
SciBase Journals
SciBase Clinical and Medical Case Reports
ISSN 2995-5874
- Article Type: Research Article
- Volume 2, Issue 2
- Received: Mar 01, 2024
- Accepted: Apr 09, 2024
- Published Online: Apr 16, 2024
Enhancing Accuracy in Pediatric Inpatient Hospitalization Cost Estimation: A Machine Learning-Based Approach
Sarmad Zafar1*; Mishaal Amin1; Muhammad Affan1; Saleha Zubairi1; Zahra Hoodbhoy2; Babar Hasan3; Tariq Mahmood1
1Department of Computer Science, Institute of Business Administration Karachi, Pakistan.
2Department of Paediatrics and Child Health, Aga Khan University, Karachi, Pakistan.
3Division of Cardiothoracic Sciences, Sindh Institute of Urology and Transplantation, Karachi, Pakistan.
*Corresponding Author: Sarmad Zafar
Department of Computer Science, Institute of Business Administration Karachi, Pakistan.
Tel: +92-3418204143;
Email: s.zafar@khi.iba.edu.pk
Abstract
Objective: Accurately estimating inpatient billing costs during admission is important for financial planning in healthcare. Traditional methods have limitations in capturing true cost; hence, data-driven approaches are needed to improve hospital cost estimation in complex and dynamic environments. The main objective of this study is to predict a deviation between the initial hospital bill estimate and the actual bill charged at the time of discharge. This study is also focused on identifying the major factors contributing towards the cost of hospital stay.
Methods: This study utilized dataset of approximately 22,000 pediatric patients (under 18 years of age). The main features of the dataset included medical conditions, hospital administration details, and socio-demographic information. The methodology utilizes named entity recognition techniques to extract structured data from unstructured textual data. Subsequently, a variety of machine learning classification models are trained and tested to predict deviations in hospital bill estimates.
Results: The boosting ensemble and artificial neural network classifier models performed best in predicting the deviations in the billing cost, with best accuracy, AUC and F1-scores of 80%, 77% and 77% respectively. The analysis of the important features revealed that age, length of stay, financial status of patients as main features to predict deviation in hospital bill estimates.
Conclusion: The results obtained from our study demonstrate that leveraging machine learning techniques provides a reliable and efficient means of improving the performance of hospital billing estimations. These findings have significant implications for healthcare practitioners, enabling them to make more informed decisions and allocate resources effectively.
Keywords: Hospital stay; Health expenditures; Machine learning; Natural language processing.
Citation: Zafar S, Amin M, Affan M, Zubairi S, Hoodbhoy Z, et al. Enhancing Accuracy in Pediatric Inpatient Hospitalization Cost Estimation: A Machine Learning-Based Approach. SciBase Clin Med Case Rep. 2024; 2(2): 1021.
Introduction
The high cost of hospitalization can be a significant burden on patients and their families, leading to financial stress, especially in developing economies where public healthcare facilities are not well-established, and the majority of the population lacks access to medical insurance. Pakistan is among those countries with the highest share of out-of-pocket payments (made at the time of getting medical services, excluding reimbursements from government or insurance companies or funds) relative to total health expenditure [1-3]. In this context, with the increasing expenditure on healthcare services, hospital billing cost prediction is important as it can help patients make informed decisions regarding their healthcare needs and plan their finances accordingly. Accurately predicting hospitalization costs can also help healthcare providers and policymakers allocate resources more effectively, reducing the burden on patients and improving their overall healthcare experience [4]. However, the deviation of these predictions from the actual hospital bills, which can result from unexpected medical procedures, complications, or incorrect billing estimates, can cause additional financial strain for patients [5] and poor patient satisfaction [6]. By understanding these deviations, patients, healthcare providers, and insurance companies can better plan for the costs associated with hospitalization and take necessary steps to minimize the impact.
Hospital bill prediction has been an area of interest for researchers since the late 1980s. Various approaches, including statistical models and machine learning techniques [1,2], have been used in the literature [7,9]. Traditionally statistical models and regression analysis have been used to predict the cost of hospitalization, using demographic, clinical, and financial data [10,11]. Recently, machine learning techniques, such as decision trees, random forests, and gradient boosting, have also been used for hospital bill prediction. These techniques have been found to be effective and have shown promising results in terms of accuracy and stability in estimating the billing cost compared to the traditional methods employed in hospital for providing bill estimates [12-16]. Moreover, Bayesian modeling has also been used to forecast hospitalization costs [17]. Recent studies have focused on improving the accuracy of hospital bill prediction using artificial neural networks and deep neural network-based learning techniques, such as convolutional neural networks and recurrent neural networks. These techniques have been applied to large datasets to predict the cost of hospitalization for specific diseases and conditions [18,19]. Moreover, literature suggests that various factors including patient demographics, medical history, and length of stay are strongly correlated with accurate estimates of hospital bills.
It is pertinent to mention that the aforementioned research has largely been conducted in advanced economies, such as the US and Europe, with little focus on developing economies like Pakistan. This is a significant gap, given the vast differences in healthcare systems and hospitalization patterns in these countries. Also, health-seeking practices are influenced by various physical, financial, social, and political factors, and these factors differ significantly between developing and developed economies.
To address this gap, this research aims to develop a predictive model for hospitalization costs by utilizing pediatric patients’ data from a private tertiary care hospital in Pakistan. Currently, the hospital relies on traditional statistical methods to estimate the total cost of hospital stays at the time of admission, but more than one third of the time, the actual billing costs deviate from the initial estimates with a margin of greater than 20%. The primary objective of this study is to predict this cost deviation of >=20% between initial cost estimates and actual billing costs for the inpatient stays using a machine learning approach.
Materials and methods
Study setting and data variables
The study was conducted on dataset from the Aga Khan University Hospital (AKUH) Karachi, a renowned not-for-profit tertiary healthcare institute that provides all medical services under one roof. The patient population at AKUH is highly diverse, comprising individuals from various regions of the country and abroad. We utilized patients having an inpatient hospital visit from January 1, 2015 to November 30, 2019. Patients older than 18 years at the time of admission were excluded, as our study was centered on pediatric patients. Furthermore, records of inpatients admitted for planned treatments, operations, or examinations were also excluded. The primary outcome of interest was the discrepancy between the billed amount at the time of discharge and the initial estimation. This outcome variable is binary, taking on the values of “true” or “false.” When labeled as “true,” it indicates that the estimated bill differs by more than 20% in either direction (20% higher or lower) from the actual bill. On the other hand, when labeled as “false,” it indicates that the estimated bill falls within a 20% range of the actual bill.
Data variables
The dataset consisted of records of pediatric patients, (<18 years of age), admitted to the hospital from the Emergency Room (ER). It contains 21,950 patient records, with relevant attributes such as the patient’s medical condition, demographics information, and hospital administration information. Socio-demographic attributes include age, gender, address, and financial class, representing the patient’s funding source (out-of-pocket, insurance, welfare programs) (Table 1).
Methodology
Our study leverage the vast amount of data of patient collected in hospitals, to enhance the accuracy of inpatient hospitalization cost estimation. The methodology involved several key steps, as depicted in the block diagram in Figure 1. The data underwent preprocessing to handle diverse formats, and named entity recognition was used to convert it into structured data. Machine learning models were then trained and evaluated based on accuracy, AUC, and F1-score metrics.
Pre-processing and feature engineering
In healthcare, the main source of information is clinical history, which is often in the form of unstructured text. This text can be used to extract information about patients’ diagnoses, medications, symptoms, and other clinical factors [20]. Dataset used in this study includes two unstructured features, i.e., visit reason and address, visit reason were not ICD coded, instead it contain textual statements of possible diagnoses recorded by the attending physician in ER, while address contains lengthy textual descriptions of patients’ addresses. These data were preprocessed and converted to usable features for further application of machine learning. For visit reason a Named Entity Recognition (NER) approach [1,2,22] was employed, which includes standardizing words through lemmatization and then filtering specific words with part-of-speech tagging to extract nouns, adjectives, and prepositions. The data was then corrected for spelling errors using a medical and English language dictionary and repetitive phrases were eliminated, while abbreviations were replaced with full forms for consistency. Using this approach, a set of generalized diseases (Table 1) was obtained. A similar approach was employed to patient address data; initially, multiple data entry errors were removed in almost 80% of the data in street, district and area names before applying NER using a location dictionary of Karachi districts to generate the Address feature (Table 1). This dictionary was built personally after extensive online research to obtain the list of standard and acceptable districts of Karachi.
Machine learning
In this study, several ML models were evaluated and compared to select the model that achieves the best performance, as the performance of ML models can vary from one dataset to another based on the characteristics of the attributes and the outcome. Table 2 shows eight standard classification models, and the ten different state-of-the-art algorithms selected under these models (underlined), based on their popularity and application in global industries [1,2,21].
Patients’ data was randomly divided into training (80%) and testing (20%) sets. The algorithms were evaluated on three metrics, i.e., accuracy, Area under the Curve (AUC), and F1-score; F1-score is a harmonic mean which gives an aggregate number for both precision and recall [1,2]. As compared to related work, we use multiple metrics to acquire a more robust evaluation; an algorithm is better than others if it performs better over multiple metrics than one. Ten-fold cross-validation was used in the training phase to ensure that the training remained unbiased.
Moreover, extra Tree Classifier [1,2] was used for determining the features importance in predicting deviation, which is considered more robust stochastically compared to correlation. It is a decision tree that uses randomly selected subsets of features to build multiple decision trees. It is better for feature selection than other methods because it reduces overfitting by using many random decision trees and combines their outputs to make predictions. Additionally, the randomness in the feature selection process makes it less biased towards specific features.
Results
Our dataset comprised of 21,950 patients, of which 39.9% were female and 60.1% were male. The average age of patients was 4.2 years, with 75% of patients under 7 years old. Along with age, the Length of Stay (LoS) is also positively skewed, with a mean of 3.5 days, a median of 2 days, and an interquartile range of 2 to 4 days. The important findings of the statistical data analysis are presented in Table 3. Around 35.3% (7,750 out of 21,950) of patient bill estimates deviate from their actual bill; the remaining 65% fall within the estimated range. Nearly 95% of patients have a LoS of less than 15 days, and over 82% have a LoS of less than 5 days. These and other statistics in Table 3 validate that our data is clear of significant outliers and anomalies and hence presents a standard predictable ML problem with a slight class imbalance [1,2].
Patients with shorter LoS had lesser deviations while deviation increases with increasing LoS. However, the deviation in the actual bill and estimated remained on average around 35% across all age group, with a marginal variation of ±2.7% among the different groups. The data also showed some seasonal patterns, with the highest number of patients admitted in the month of June, while the deviation in billing estimates increased in the months of February, August, and November compared to the remaining months, though the variance was not significant.
The primary objective of this research is addressed through the ML results on testing data shown in Table 4 (overall top-3 results highlighted), with values rounded-off to nearest integer. In accuracy, gradient boosting and MLP performed best (80%), followed by XgBoost, Adaboost, Logistic Regression, and SVM (79%).
The top-7 feature list given by Extra Tree Classifier (in descending score) is as follows: Age (derived from Date of Birth), Stay (LoS), Visit Reason, Financial Class, Location, Care Level and Gender (Figure 2). Patient’s age is a more important predictor of financial deviation for our patient sample as compared to LoS; it is also the best predictor. However, LoS ranks as the second most important feature according to the ETC method. But, it exhibits the highest correlation score among all the features, which can be attributed to its direct proportionality with hospitalization cost. Longer stays naturally result in higher cost. Other important predictors are related to the financial status of the patient (Financial Class and Adm Care), Additionally, the features Visit Reason and Address, extracted using NER (Named Entity Recognition) methods, both appear in the top five features based on both ETC scores and correlation scores.
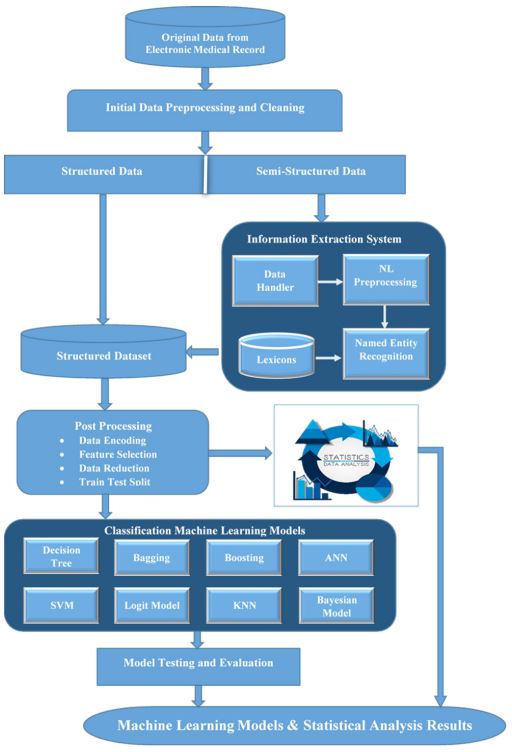
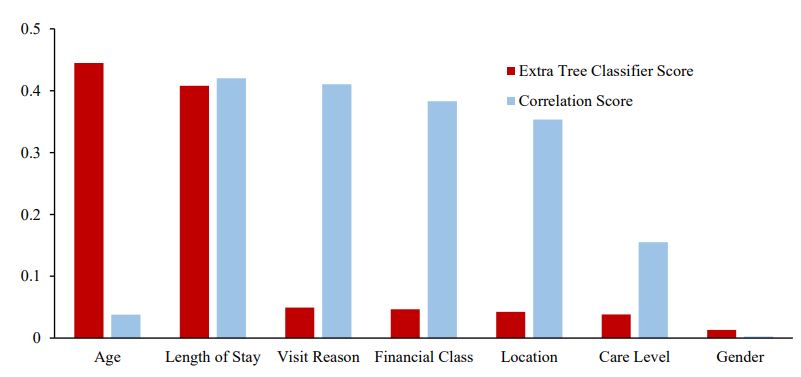
Table 1: Features description.
| Field Name | Description | Data Type |
|---|---|---|
| Account no | Unique number for administrative use | Integer |
| Address | Karachi District of the patient’s house address | String (25 categories) |
| Street | Area of house address | |
| Financial class | Represent the source of patient funds | String (5 categories) |
| Admission date | Date of hospital admission | Date (DD/MM/YYYY) |
| Discharge date | Date of hospital discharge | Date (DD/MM/YYYY) |
| Visit reason | Reason of visit assessed by ER consultant | String (15 categories) |
| Stay (days) | Length of Stay | Integer |
| Admission source | Admitted via emergency or pre-planned | String (2 categories) |
| Date of Birth (Age) | Age is derived from Date of birth | Date (DD/MM/YYYY) |
| Adm care | Type and class of accommodation at the time of admission | String (3 categories) |
| Adm care level | Type of accommodation at time of admission | String (4 categories) |
| Gender | Gender: Male or Female | String (Male/Female) |
Table 2: Classification models and algorithms brief description.
| Classification Model | Description |
|---|---|
| Decision Tree | Decision tree is a tree-like structure that represents a decision-making process. Each internal node represents a test on an attribute, each branch represents the outcome of the test, and each leaf node represents a class label. Algorithm: Decision Tree Classifier (DTC) |
| Bagging | Bagging is an ensemble method that combines multiple decision trees to improve accuracy and robustness. Each decision tree is built on a random subset of the data and features and hence bagging overcomes the problem of over fitting. Algorithm: Random Forest |
| Boosting | Boosting is an ensemble method that combines multiple weak tree-based models to form a single strong model. It works by iteratively training weak models and assigning higher weights to samples that are misclassified by the previous models, until a strong model is ob- tained. Algorithm: Gradient Boosting, XgBoost, AdaBoost |
| Artificial neural network (ANNs) |
ANNs attempt to mimic the human brain to model complicated tasks. It consists of a set of interconnected nodes, called neurons; the signals at each neuron are weighted and added together before being applied to an activation function to produce the output. The output signals from the neuron are then propagated to other neurons until the output of the network is reached. Algorithm: Multi-Layer Percep- tron (MLP) |
| Support Vectors | Support Vector classifiers output an optimal hyperplane in the N-dimensional space, where N is the number of the features. They estimate a hyperplane that maximizes the margin, i.e., the distance between the hyperplane and the closest data points from each class. They are effective for non-linearly separable data by using kernel functions to transform the input data into a higher-dimensional space. Algorithm: Support Vector Machines (SVM) |
| Logit Model | Logit models model the of the different categories of the response variable as a function of the independent predictor variables using a logistic function. It is like multiple linear regression except that the response variable is categorical. Algorithm: Logistic Regression |
| Nearest neighbor | Nearest neighbor works by finding a pre-determined number of nearest neighbors to a given data point and predict the class based on the majority vote of these neighbors. Algorithm: K-nearest neighbor (K-NN) |
| Bayesian Model | Bayesian approaches are probabilistic and calculate the likelihood of each predictor variable given the class label, and the prior probability of each class label. They combine these probabilities using Bayes' theorem to calculate the posterior probability of each class label given the predictor variables. Algorithm: Naïve Bayes |
Table 3: Summary of statistical data analysis.
| Total Record | Dataset = 21950 |
|---|---|
| Deviation in Bill | |
| True (Percentage (No of Records)) | 35.3% (7750) |
| False (Percentage (No of Records)) | 64.7% (14200) |
| Sex: Male (Percentage (No of Records)) | 60.1% (13188) |
| Female (Percentage (No of Records)) | 39.9% (8762) |
| Age (Mean (SD)) | 4.2 (5.0) Years |
| Length of Stay: (Mean (SD)) | 3.5 (4.7) Days |
| Length of Stay (Grouping on no of days) | Distribution (Percent of total records) | Deviation Rate in Group (%) |
|---|---|---|
| Los < 1 – Deviation in Bill | 2.7% | 16 out of 595 (2.7%) |
| Los b/w 1-3 – Deviation in bill | 56.1% | 1975 out of 12304 (16.1%) |
| Los b/w 3-5 – Deviation in bill | 22.0% | 2382 out of 4822 (49.4%) |
| Los b/w 5-10 – Deviation in bill | 13.1% | 2115 out of 2880 (73.4%) |
| Los >10 – Deviation in bill | 6.1% | 1262 out of 1349 (93. 6%) |
| Age(Grouping on years old) | Distribution (Percent of total records) | Deviation Rate in Group (%) |
| Age <1 mo – Deviation in bill | 15.7% | 1106 out of 3453 (32.0%) |
| Age b/w 1 mo -1y – Deviation in bill | 25.2% | 2078 out of 5525 (37.6%) |
| Age b/w 2 - 12 – Deviation in bill | 47.5% | 3560 out of 10420 (34.2%) |
| Age >12 – Deviation in bill | 11.6% | 1006 out of 2552 (39.4%) |
Table 4: Machine learning results on testing data.
| Model | Accuracy (%) | AUC (%) | F1-Score (%) |
|---|---|---|---|
| Logistic Regression | 79 | 73 | 63 |
| Gradient Boosting | 80 | 76 | 69 |
| XgBoost | 79 | 77 | 70 |
| AdaBoost | 79 | 75 | 67 |
| K-Nearest Neighbour | 77 | 73 | 64 |
| Support Vector Machine | 79 | 73 | 64 |
| Multi-Layer Perceptron | 80 | 76 | 69 |
| Random Forest | 74 | 71 | 63 |
| Decision Tree Classifier | 72 | 69 | 60 |
| Naïve Bayes | 67 | 65 | 55 |
Discussion
The abundance of patient medical and administrative data presents valuable opportunities for training data-driven models, such as machine learning algorithms, to accurately predict key variables like hospital bill, patient mortality and length of stay. In this study, we leveraged a dataset containing records of 21,950 pediatric patients for predicting the deviation in actual hospital bill. We employed multiple machine learning models, our findings indicate that gradient boosting and MLP achieved the highest accuracy, reaching 80%, while XgBoost excelled in AUC with 77% and F1-score with 70%. Patient age and Length of Stay (LoS) emerged as the most influential predictors of bill deviation. Additionally, patient financial class, visit reason, and location were also identified as important factors in predicting outcomes.
Moreover, the complexity of our data and hence, the difficulty in model training, is verified from the fact that, after following all steps of the standard machine learning pipeline to generate thorough experimentation, we still acquired an overall accuracy of only 80%. Comparing with related work, a study predicted hospital cost with 76.5% accuracy and 75% AUC after anatomic and reverse shoulder arthroplasty [18], while a similar study achieved 83% AUC using logistic regression and random forest for predicting the total cost of care among shoulder arthroplasty patients [12]. These scores are comparable to ours, offering further proof of the data complexity in patient data. Also, our work is better and more generalizable than both because we demonstrate superior performance by using multiple classification models and multiple metrics.
When comparing our results with related works, our selection of multiple performance metrics in Table 4 provides a better idea of the strength of classification models. The results clearly show that, across all three metrics, boosting models outperform all other models followed closely by neural network models. In fact, gradient boosting and neural network-based models (in deep learning) continue to demonstrate superior classification performance across many application domains [21]; our results largely corroborate these trends. It is notable that support vector and logistic regression offer tough competition to boosting and MLP algorithms, especially in accuracy. The Bayesian models are the worst performers on all metrics, because the diversity of feature values in our dataset prevents the independent stochastic combinations of these predictor values to accurately compute class probabilities. The decision tree model also underperforms; there are too many diverse combinations of predictor values to estimate a balanced decision tree that is robust on test data. Moreover, a surprising result is that bagging model including the famous random forest algorithm has also underperformed; apparently, the data diversity is complex enough to prevent an ensemble of multiple (bagged) decision trees to give a reasonable aggregate prediction.
The results for F1-score corroborate this trend. F1 is an aggregate for precision and recall. The average F1-score across all models is ~65%, meaning that out of 100 predictions, the number of correct predictions (for both true and false deviations) is 65, and out of 100 rows of the test set, our models have predicted 65 rows precisely on average. Compared to the generally expected score of 85% or more for these metrics, our results are apparently underperforming. However, the monetary benefit to the hospital and the increase in patient satisfaction for even 65% F1-score and 80% accuracy can hardly be underestimated. What this means is that, out of 100 patients, our boosting model can correctly predict true and false deviation for 80 patients, out of which 65 patients will have more confident predictions with respect to precision and recall.
Furthermore, through statistical analysis, we discovered that accurate estimates of LoS are essential for more accurate predictions. However, the age of patients is even more critical than LoS; we believe that discovering accurate patient clusters of age and LoS values collectively can help us understand which clusters are more prone to generate deviations. To improve this clustering, we can add features related to the financial capacity of the patients, with different financial classes having different financial capabilities to pay for healthcare services [22]. For example, patients with health insurance may have a higher willingness to pay for healthcare services than patients who are paying out-of-pocket and are more likely to forgo or delay, nonessential and non-critical procedures. While the variable “financial status” incorporates some aspects of this feature by categorizing patients as self-paid, hospital employees, government employees, or welfare recipients, it fails to explicitly differentiate whether self-paid individuals are paying out-of-pocket or through insurance. Similarly, the patient’s locality also partially reflects their financial well-being. Finally, our NER-based features, Visit Reason and Address, played an important role in improving the prediction of hospitalization costs. Since diagnosis at the time of admission is often the only available feature related to reason of admission and can have a significant impact on the cost of hospitalization. Similarly, Patients from affluent areas might have better resources and opt for more expensive treatments, leading to higher hospitalization costs. On the other hand, patients from economically disadvantaged areas could potentially have lower hospitalization costs due to limited resources or different treatment preferences. Therefore, considering the address column as an input variable in the prediction model enables us to leverage this relation between patient location and hospitalization costs.
Previous studies have mostly used traditional regression techniques to predict hospital costs, but our study employs classification methods to estimate the deviation for all patients admitted with any health condition. Our study’s strength lies in its broad applicability compared to previous studies, which were limited to specific injuries, diseases, and healthcare condition. There are still some limitations, such as the focus on classifying the costs instead of estimating the actual cost and the need for more comprehensive datasets that include both clinical and billing information.
Conclusion
This study proposed a ML technique for evaluating the accuracy of billing cost estimates for pediatric patients receiving inpatient care in a tertiary care hospital in Karachi, Pakistan. Our approach, experimented over 8 different classification models and 10 algorithms and was able to predict the deviation in cost with the best accuracy of 80%, best AUC of 77% and best F1- score of 69%. The analysis of the important features revealed that age, length of stay, and financial class were the most influential factors in accurately estimating the cost. Our findings indicate that ML-based approaches are a valuable tool for improving the accuracy of inpatient hospitalization cost estimates as we achieved a 70% recall, that is identifying correctly 70% of cases where bill estimates deviate from the actual bill. In future work, we plan to enhance our approach by using real financial and billing data, larger datasets, and advanced regression models and Bayesian methods to predict the actual cost in currency and compare ML-based bill estimation with traditional methods. In an era of increasing healthcare costs and a growing emphasis on value-based care, our findings have the potential to improve healthcare decision-making and reduce costs.
References
- Mitchell TM. Machine learning. New York: McGraw-Hill. 2007.
- Bishop CM, Nasrabadi NM. Pattern recognition and machine learning. New York: Springer. 2006.
- World Health Organization. Global Health Expenditure Database. http://apps. who.int/nha/database/Select. Indicators/en.
- Austin DA, Gravelle JG. Does price transparency improve market efficiency? Implications of empirical evidence in other markets for the health sector.
- Himmelstein DU, Lawless RM, Thorne D, Foohey P, Wool handler S. Medical bankruptcy: Still common despite the Affordable Care Act. American Journal of Public Health. 2019; 109(3): 431-3.
- Andaleeb SS. Determinants of customer satisfaction with hospitals: A managerial model. International Journal of health care quality assurance. 1998; 11(6): 181-7.
- Kukull WA, Koepsell TD, Conrad DA, Immanuel V, Prodzinski J, et al. Rapid estimation of hospitalization charges from a brief medical record review: Evaluation of a multivariate prediction model. Medical Care. 1986; 961-6.
- Tielsch JM, Parver LM. Determinants of hospital charges and length of stay for ocular trauma. Ophthalmology. 1990; 97(2): 231-7.
- Polverejan E, Gardiner JC, Bradley CJ, Holmes‐Rovner M, Rovner D. Estimating mean hospital cost as a function of length of stay and patient characteristics. Health economics. 2003; 12(11): 935-47.
- Yang J, Peek-Asa C, Allareddy V, Phillips G, Zhang Y, et al. Patient and hospital characteristics associated with length of stay and hospital charges for pediatric sports-related injury hospitalizations in the United States, 2000-2003. Pediatrics. 2007; 119(4): e813-20.
- Silberstein GS. Prediction of Hospital Inpatient Charge Levels at Admission for Individual Cases. Management Accounting Quarterly. 2017; 18(3): 11.
- Gowd AK, Agarwalla A, Beck EC, Rosas S, Waterman BR, et al. Prediction of total healthcare cost following total shoulder arthroplasty utilizing machine learning. Journal of Shoulder and Elbow Surgery. 2022; 31(12): 2449-56.
- Ramiarina R, Almeida RM, Pereira WC. Hospital costs estimation and prediction as a function of patient and admission characteristics. The International journal of health planning and management. 2008; 23(4): 345-55.
- Smith MW, Friedman B, Karaca Z, Wong HS. Predicting inpatient hospital payments in the United States: A retrospective analysis. BMC Health Services Research. 2015; 15(1): 1-2.
- Kuo CY, Yu LC, Chen HC, Chan CL. Comparison of models for the prediction of medical costs of spinal fusion in Taiwan diagnosisrelated groups by machine learning algorithms. Healthcare informatics research. 2018; 24(1): 29-37.
- Thakore RV, Lee YM, Sathiyakumar V, Obremskey WT, Sethi MK. Geriatric hip fractures and inpatient services: Predicting hospital charges using the ASA score. Current Gerontology and Geriatrics Research. 2014; 2014.
- Navarro SM, Wang EY, Haeberle HS, Mont MA, Krebs VE, et al. Machine learning and primary total knee arthroplasty: Patient forecasting for a patient-specific payment model. The Journal of arthroplasty. 2018; 33(12): 3617-23.
- Karnuta JM, Churchill JL, Haeberle HS, Nwachukwu BU, Taylor SA, et al. The value of artificial neural networks for predicting length of stay, discharge disposition, and inpatient costs after anatomic and reverse shoulder arthroplasty. Journal of shoulder and elbow surgery. 2020; 29(11): 2385-94.
- Luo M, Wang YT, Wang XK, Hou WH, Huang RL, et al. A multigranularity convolutional neural network model with temporal information and attention mechanism for efficient diabetes medical cost prediction. Computers in Biology and Medicine. 2022; 151: 106246.
- Durango MC, Torres-Silva EA, Orozco-Duque A. Named Entity Recognition in Electronic Health Records: A Methodological Review. Healthcare Informatics Research. 2023; 29(4): 286.
- Guillaume Saupin. Practical Gradient Boosting: A deep dive into Gradient Boosting in Python. guillaume saupin. 2022.
- Russell S. Ability to pay for health care: concepts and evidence. Health policy and planning. 1996; 11(3): 219-37.