
SciBase Journals
SciBase Epidemiology and Public Health
ISSN 2691-7785
- Article Type: Research Article
- Volume 1, Issue 2
- Received: Oct 27, 2023
- Accepted: Dec 13, 2023
- Published Online: Dec 20, 2023
Obesity and Albuminuria in Patients with Chronic Renal Disease and Hypertension as a Comorbidity: The Optimum Body Mass Index
Vaia D Raikou1*; Sotiris Gavriil2
1Department of Nephrology, DOCTORS’ General Clinic, Athens, Greece.
2Department of Bariatric Surgery, DOCTORS’ General Clinic, Athens, Greece.
*Corresponding Author: Vaia Raikou
Department of Nephrology, DOCTORS’ General Clinic, Athens, Greece.
Tel: 00302108212000, Fax: 00302108218228;
Email: vraikou@med.uoa.gr
Abstract
Background: Obesity was associated with a greater risk for development of Chronic Kidney Disease (CKD) among subjects with and without hypertension, diabetes or cardiovascular disease. We aimed to consider the association between obesity and albuminuria in patients with CKD according to Estimated Glomerular Filtration Rate (e-GFR) and demonstrated hypertension. We also aimed to observe the optimum Body Mass Index (BMI) in this population.
Methods: One hundred-thirty-three overweight and/or obese subjects with manifested hypertension were participated and they were matched to forty-three hypertensive control subjects with a normal body weight. Our participants were classified in both eGFR and albuminuria categories according to the Kidney Disease Improving Global Outcomes (KDIGO) 2012 criteria. The obesity was defined as a high BMI (≥25 Kg/m2 as overweight and/or ≥30 Kg/m2 as obese) and the central obesity as a high waist circumference (WC) (≥94 cm in males and ≥80 cm in females).
Results: The most of subjects with a lean/normal BMI did not have albuminuria (x2=24.2, p=0.001) and the most of those with a high BMI, but with a normal WC did not have albuminuria (x2=39.7, p=0.001). The high WC was found to be a main risk factor for albuminuria adjusting to confounders.
Conclusions: The central obesity was shown to be the most important factor for albuminuria in patients with classified CKD rather than a high BMI independently on hypertension. The optimum BMI seems to be in the normal range for these patients similarly to the general population.
Keywords: Obesity; Hypertension; Renal disease; Albuminuria; Glomerular filtration rate.
Citation: Raikou VD, Gavriil S. Obesity and albuminuria in patients with chronic renal disease and hypertension as a comorbidity: The optimum Body mass index. SciBase Epidemiol Public Health. 2023; 1(2): 1010.
Introduction
Obesity, which is defined as the degree of fat storage related to elevated health risks, is an increasing problem worldwide [1,2]. Obesity is associated with higher risk of Cardiovascular Disease (CVD), type 2 diabetes mellitus, dyslipidemia, cancer and CKD [3]. Furthermore, obesity was connected with a shortened life expectancy in the general population [4,5]. Therefore, early detection and prevention of obesity is extremely important. Obesity is commonly measuring by BMI, Waist to Hip Ratio (WHR) and/or WC [6]. CKD shows also an elevated prevalence rate [7,8]. Most studies used glomerular filtration rate (GFR < 60 ml/min per 1.73 m2 ) to identify CKD and few have combined GFR and albuminuria categories, both of which are required for the diagnosis of CKD [9,10]. Moreover, hypertension in combination with diabetes mellitus are traditional risk factors and potential leading causes for development of CKD [11]. Reversely, renal function plays an important role in initiating hypertension particularly during obesity by multiple mechanisms including increased renal tubular sodium reabsorption and activation of the Renin-Angiotensin-Aldosterone System (RAAS) [12].
In the meantime, it has been reported that the association between a high BMI and CKD risk and its progression was similar among subjects with and without hypertension, diabetes or cardiovascular disease, despite being overweight increases the risk of advanced CKD in people with these comorbidities [13]. However, the effect of obesity in population with both classified CKD and comorbidities is unclear. Recent study reported that obesity did not confer an increased risk of End-Stage Renal Disease (ESRD) in patients with moderate to advanced CKD [14]. In this study, we aimed to consider the association between obesity and albuminuria, as an early marker of kidney disease, in patients with CKD according to Estimated Glomerular Filtration Rate (e-GFR) and manifested hypertension, as a comorbidity. We also targeted to observe the optimum BMI range in such as population.
Materials and methods
Subjects: This is a single-center cross-sectional study in which one hundred-thirty-three overweight and/or obese subjects with manifested hypertension were enclosed. The participants were collected from the Department of Nephrology outpatient clinic of our private Hospital. We also collected forty-three people with a normal body weight and manifested hypertension as a control group matched to the age, gender, classified eGFR value, diabetes mellitus and hypertriglyceridemia with the enrolled in the study high body weight subjects. We studied sixty-six males and sixty-seven females on mean age 72.5±11.7 years old. Subjects younger than eighteen years old and uncooperative patients were excluded. Those with established dementia or psychiatric symptomatology diagnosed by neuropsychologists were also excluded from the study.
Detailed individual medical histories, family histories of kidney/cardiovascular diseases and the current pharmaceutical therapy were obtained from the patients. The causes for the development of chronic renal disease in our data included hypertensive nephrosclerosis (53.4%), type 2 diabetes mellitus (32.3%), chronic glomerulonephritis (5.3%), interstitial nephritis (6.0%) and other/unknown (3.0%). Both the enrolled subjects and the control group were receiving anti-hypertensive medications including calcium channel blockers, beta-blockers, inhibitors of angiotensin II AT1 receptors or new central-acting. The participants and control group were also using hypoglycemic and hypolipidemic medications, in cases where it was required.
Demographic data including age, gender, marital status, education level, sleep and lifestyle characteristics regarding with active or passive smoking, alcohol drinking and physical activity were collected using interviews. Subjects who declared no alcohol consumption during the past month were considered nondrinkers. Physical activity was measured based on the World Health Organization (WHO) recommendations for healthy adults and physical inactive participants were considered sedentary [15].
Anthropometric measurements including height (to the nearest 0.1 cm), body weight (to the nearest 0.1 kg) were recorded by our staff using an anthropometer (Seca, Hamburg, Germany). BMI was calculated by dividing the body weight in kilograms by the square of the height in meters (kg/m2) and categorized based on the WHO classification into underweight (< 18.5 Kg/m2), normal weight (18.5-24.9 Kg/m2), overweight (25-29.9 Kg/m2) and obese (≥30 Kg/m2) [16]. WC measurements made approximately at the midpoint between the lower margin of the last palpable rib and the top of iliac crest at the end of a normal expiration according to the WHO guidelines and were also recorded by our trained staff [17].
Biochemical measurements
Overnight fasting plasma glucose, creatinine, triglycerides, High-Density Lipoprotein-Cholesterol (HDL-C) were recorded from the patient files using the latest results. Biochemical markers were measured using spectrophotometric technique by Chemistry Analyzer (MINDRAY BS-200, Diamond Diagnostics, USA) and were represented as mg/dL. Spot urine samples from the first morning uresis were used for the measurement of albumin and creatinine concentrations by the chemistry analyzer.
Definitions
The obesity was defined by a high BMI (≥25 Kg/m2 as overweight and/or ≥30 Kg/m2 as obese defined classes) and by the existence of central obesity, which was determined using a measurement of WC≥94 cm in males and ≥80 cm in females according to International Diabetes Federation (IDF) criteria for Metabolic syndrome diagnosis [18]. We enclosed exclusively hypertensive people. As hypertensive were defined the subjects, who had a systolic blood pressure (SBP) ≥140 mmHg and/ or a diastolic blood pressure (DBP) ≥80 mmHg and/or with taking antihypertensive therapy due to pre-existed individual history of hypertension [18]. The presence of chronic renal disease was defined according to the Kidney Disease Improving Global Outcomes (KDIGO) 2012 criteria for a duration time more than 3 months [19]. The eGFR was calculated using the Chronic Kidney Disease Epidemiology Collaboration (CKD-EPI) equation and the Modification of Diet in Renal Disease (MDRD) equation and classified in 5 categories according to KDIGO 2012 criteria.
The enrolled subjects were also classified based on albuminuria, which was defined as urinary Albumin-to-Creatinine Ratio (ACR) ≥30 mg/gr according to KDIGO 2012 [19]. The ACR calculation using a spot urine sample, such as in this study, is considered an acceptable method, as ACR is correlated well with 24-hours urinary albumin excretion.
Data analysis
Data were analyzed using SPSS 15.0 statistical package for Windows (SPSS Inc, Chicago, Illinois) and expressed as mean ± standard deviation or as median value ± inter-quartile range for data that showed skewed distribution. Differences between mean values were assessed using unpaired t-test for two groups and data that showed skewed distributions were compared with Mann-Whitney U- test.
Correlations between variables were defined by Spearman coefficient and correlations between categorical variables were defined by chi-square tests. P values less than .05 were considered significant. We built a model using logistic regression analysis for the role of obesity on the development of albuminuria adjusting for confounders.
Results
In Table 1 the differences between high BMI hypertensive subjects and normal BMI hypertensive control group are shown. We observed that the patients with high BMI had significantly higher WC and albuminuria than the normal BMI control group. However, the prevalence rate of diabetes mellitus, classified eGFR value, the age, gender and/or hypertriglyceridemia (less or more than 150 mg/dl) did not differ between high BMI participants and lean/normal BMI control group according to our criteria for the definition of the proper control group. Moreover, the systolic and diastolic blood pressure levels did not differ between both groups.
In support, chi-square test showed significant association between high WC and BMI classes (x2 =24.9, p=0.001). However, as it is depicted in Table 1, a ratio closed to the half of our normal BMI control group (n=21, a ratio of 48.8%) had visceral obesity defined by a high WC, although twenty-two of our subjects with a high BMI (overweight and/or obese, a ratio of 16.5%) had a normal WC.
In the meantime, in lean/normal BMI control group classified eGFR was significantly associated with high or normal WC (n=43, x2 =14.9, p=0.002, Figure 1). We particularly notified that in normal BMI group of subjects a high WC was found in earlier eGFR stages compared to advanced stages of eGFR classification (a ratio equal to 92.3% for an eGFR>60 ml/min/1.73 m2 vs a ratio equal to 30% for an eGFR <60 ml/min/1.73 m2).
We also observed significant association between classified albuminuria and BMI classes (n=176, x2 =24.2, p=0.001, Figure 2). As it is depicted in Figure 2, the most of our normal BMI control group (n=28 from the total of forty-three people) had not albuminuria (ACR<30 mg/gr) and few of them (n=11 from the total of forty-three people) had microalbuminuria.
Furthermore, classified albuminuria was significantly associated with high WC in the group of patients with overweight and/ or obese BMI (n=133, x2 =39.7, p=0.001, Figure 3). According to the figure 3, the most of our subjects with a high BMI in combination with a normal WC (n=19 from the total of twenty-two participants) had not albuminuria (ACR<30 mg/gr), 2 participants had microalbuminuria and only 1 had macroalbuminuria.
The bivariate correlations between albuminuria and both BMI and WC were also found to be significant (r=0.263, p=0.002 and r=0.528, p=0.001 respectively).
The built adjusted model for albuminuria prediction showed that both the presence of central obesity defined by a high WC and the low eGFR value were found to be significant risk factors (p=0.001, OR=1.08, 1.05-1.12 and p=0.001, OR=0.9, 0.93-0.98 respectively) adjusting to the age, diabetes mellitus, smoking, high serum triglycerides and primary renal disease.
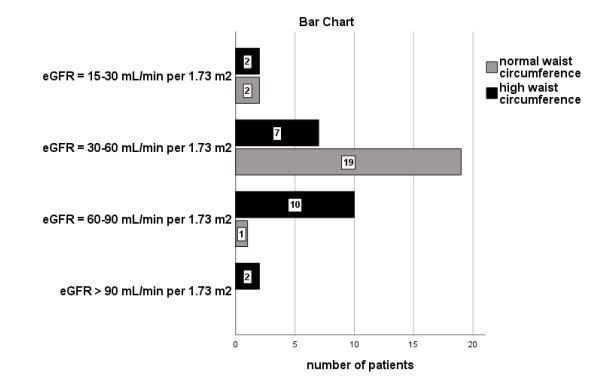
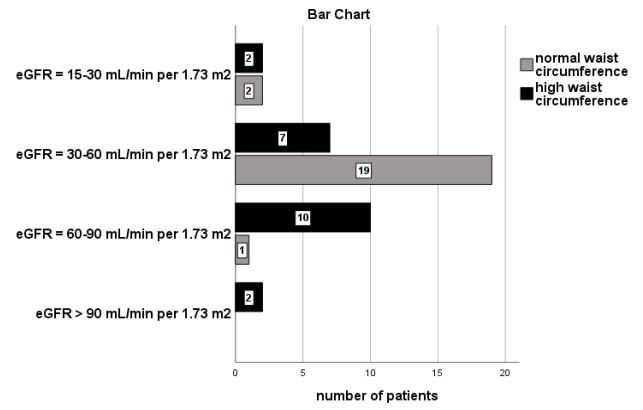
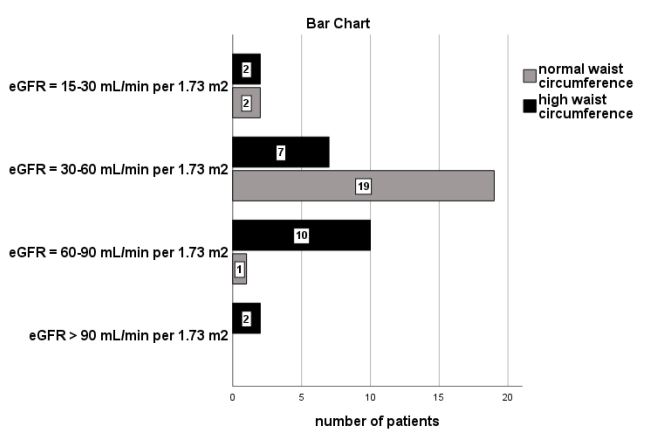
Table 1: The differences between high BMI subjects (n=133) vs normal BMI control group with chronic renal disease and hypertension (n=43) (*: p< 0.05).
| Characteristic |
Patients with BMI≥25 Kg/m2 (n=133) Mean ± SD |
Patients with BMI=18.5-24.9 Kg/m2 (n=43) Mean ± SD |
P value |
|---|---|---|---|
| Sex (males/females) | 66-67 | 28-15 | 0.06 |
| Age (years) | 72.4±11.7 | 71.4±14.7 | 0.6 |
| Systolic blood pressure (mmHg) | 157.7±6.6 | 157.8±9.09 | 0.9 |
| Diastolic blood pressure (mmHg) | 89.6±4.2 | 90.7±3.3 | 0.1 |
| BMI (Kg/m2) | 30.9±3.9* | 23.5±0.6 | 0.001 |
| ACR (mg/gr) | Mean Rank=97.6* | Mean Rank=59.5 | 0.001 |
| eGFR (ml/min/1.73 m2) | 44.6±18.8 | 50.3±21.1 | 0.09 |
| HDL (mg/dL) | 43.4±8.6 | 44.5±7.4 | 0.4 |
| Triglycerides (mg/dL) | 167.1±71.7 | 149.4±43.08 | 0.1 |
| Waist circumference (cm) | 107.6±16.06* | 93.2±10.3 | 0.001 |
| Glucose (mg/dL) | 117.5±28.3 | 108.0±24.2 | 0.06 |
| Diabetes mellitus (yes/no) | 43/90 | 14/29 | 0.6 |
| Triglycerides (>/< than 150 mg/dL) | 87/46 | 26/17 | 0.3 |
| High waist circumference (yes/no) | 111/22 | 21/22 | 0.001 |
| ACR>or<30 mg/gr (yes/no) | 94/39 | 15/28 | 0.001 |
| Smoking (yes/no) | 25/108 | 10/33 | 0.3 |
| Alcohol (yes/no) | 40/93 | 14/29 | 0.4 |
| Physical activity (yes / no) | 43/90 | 17/26 | 0.2 |
|
Classification based on
eGFR: - eGFR >90 ml/min/1.73 m2 - eGFR=60-90 ml/min/1.73 m2 - eGFR=30-60 ml/min/1.73 m2 - eGFR=15-30 ml/min/1.73 m2 - eGFR<15 ml/min/1.73 m2 |
n=4 n=26 n=71 n=29 n=3 |
n=2 n=11 n=26 n=4 n=0 |
0.3 |
Discussion
According to WHO the definition of obesity includes the rate of body fat, which is mainly calculated by a Body Composition Monitor as body fat percentage >25% in men and >35% in women and its accuracy has been validated against of the Dual Energy X-Ray Absorptiometry (DEXA) that is the gold standard reference method [14,20,21]. However, because of such as direct measurement of fat is difficult in clinical practice, BMI, WHR and/or WC measurements are used as screening tools for obesity [6].
In this study, we used the BMI calculation to classify the normal people as a control group, overweight and/or obese subjects and we also used the WC measurement >94 cm for men and >80 cm for women to define the central obesity. We observed that almost the half of our subjects with a normal BMI (a ratio of 48.8%) had central obesity, although a ratio of 16.5% of our subjects with a high BMI had not central obesity.
In agreement, previously, it has been reported diagnostic discordance between BMI and the degree of body fat in chronic renal disease patients, due mainly to the limitations of BMI to define obesity in these patients. Hence BMI does not evaluate the muscle wasting usually seen in patients with CKD, it may misclassify patients with CKD with sarcopenic obesity as normal, although their body fat would classify them as obese [22]. Therefore, the measurement of BMI for adiposity determination may confuse the association between BMI and mortality risk in CKD. It has been shown that being obese may be protective for all-cause mortality in the pre-dialysis and hemodialysis populations, while being underweight suggests increased risk in contrast to the general population, that is called “obesity paradox phenomenon” [6,23,24]. Moreover, previous study reported that the optimal BMI to protect the renal function was in the overweight field rather than in the lean or normal range of BMI, because such BMI may obtain the avoidance of sarcopenia [25]. Controversially, recent study using a cohort of 1.4 million primary care registered adults showed directly that being overweight increases the risk of advanced CKD mainly defined by eGFR measurements among people without and/or with other CKD risk factors, including diabetes, hypertension and cardiovascular disease [13].
The above study defined the optimum BMI for minimizing CKD risk in the lean/normal range rather than in overweight and/or obese to the study participants, who were in earlier CKD stages than advanced renal disease. The early CKD may be less likely to be affected by the altered appetite, malnutrition and sarcopenia that can be caused by the end stage of renal disease and its causes.
However, in our study, considering the lean/normal BMI control group we noted that central obesity was evaluated in a ratio equal to 92.3% (n=12 patients from a total of 13 patients) for an eGFR>60 ml/min/1.73 m2 and in a ratio equal to 30% (n=9 patients from a total of 30 patients) for an eGFR <60 ml/min/1.73 m2 , as it is depicted in Figure 1. Sarcopenic obesity may be demonstrated even in early CKD, despite the advanced renal failure seems to decrease the rate of adipose tissue in combination with muscle wasting resulting perhaps in additional detrimental metabolic effects in CKD patients.
Moreover, our findings showed that the most of our subjects with a normal BMI had not albuminuria (n=28, a ratio of 65.1%), rather than the patients in overweight and/or obese BMI, as it is depicted in Figure 2. We also noted that the most of our group of patients with high BMI in combination with a normal WC had not albuminuria compared with those with high BMI and high WC, as it is shown in Figure 3. In support, the bivariate correlation between albuminuria and both high BMI and high WC was found to be significant. The high WC was also found to be a significant risk factor for albuminuria prediction in our adjusted model including confounders.
Such as findings suggest that the optimum BMI for decreased albuminuria in chronic renal disease stages with the comorbidity of hypertension is better to be found in the lean/normal range rather than in overweight. Moreover, the visceral obesity defined by a high WC was shown to be an extremely important factor for manifested albuminuria rather than the high BMI in agreement with few previous reports [26,27]. Visceral adipose tissue has been considered the active organ, which is connected with the pathophysiological mechanisms of obesity-induced kidney disease. Visceral obesity and adipose tissue expansion is highly correlated with insulin resistance [28]. Adipokines produced by adipose tissue promote chronic inflammation and oxidative stress that exacerbate insulin resistance. Insulin resistance and inflammation are associated with multiple abnormalities including endothelial dysfunction, reduced synthase of endothelial nitric oxide, worsening of renal hemodynamic and injury of podocytes resulting in hypertension and albuminuria [26,27].
However, multiple factors influence the manifestation of albuminuria in overweight/obese CKD patients including the existence of diabetes mellitus, hypertension and hyperlipidemia. Indeed, these comorbidities are connected to insulin resistance. It has been particularly reported that insulin resistance is associated with hyperlipidemia defined by overproduction of lowdensity lipoprotein cholesterol and hypertriglyceridemia, which may impair the mitochondrial function and promote the kidney cell damage resulting in albuminuria [29]. In this study, diabetes mellitus, blood pressure levels and either hypertriglyceridemia might not influence the demonstration of albuminuria, due to our criteria for the properly matched control group and the visceral obesity could be considered as the main risk factor for albuminuria prediction.
Furthermore, we matched our participants with the control group for classified eGFR, due to eGFR value influences the demonstration of albuminuria. Indeed, our adjusted model showed the low eGFR value to be a significant risk factor for albuminuria prediction in combination with central obesity including confounders. Albuminuria is an early marker of kidney injury and commonly is associated with a low eGFR in chronic kidney disease, despite in some cases the findings are different. The primary cause for the low eGFR, including hypertensive nephrosclerosis, Type 2 diabetes mellitus, chronic glomerulonephritis, interstitial nephritis and other/unknown, was also considered as an additional confounder in our adjusted model and it was found to be non-significant for albuminuria prediction, due may to our criteria for the good matched control group.
According to the results of this study, independently on the manifested hypertension as comorbidity, the central obesity was mainly found to be a significant predictor for the demonstration of albuminuria, as an early marker of kidney disease in patients with classified CKD. Despite the BMI limitations, we could suggest the lean/normal BMI range as the optimum BMI to properly avoid the manifestation of albuminuria and protect the renal function instead of overweight and/or obese BMI range in renal disease patients with hypertension. Strategies to reduce weight among those who are overweight and/or obese in combination with the avoidance of muscles wasting by using physical activity may reduce CKD risk.
Limitations
The main limitation of this study is the small number of enclosed patients by the Department of Nephrology of one singlecenter. The assessment of body fat percentage with the use of the Body Composition Monitor was also unavailable.
Conclusion
The central obesity was found to be the main risk factor for the manifestation of albuminuria in patients with classified CKD rather than a high BMI independently on the existence of hypertension as a comorbidity. The lean/normal BMI range could be the optimum BMI for the avoidance of albuminuria and to protect the renal function instead of overweight and/or obese BMI.
Highlights
• Regardless of hypertension, the central obesity was found to be a significant predictor for the albuminuria demonstration.
• Albuminuria is an early kidney disease marker in subjects with classified chronic renal disease rather than the high BMI.
• A lean/normal BMI was found to be an optimum range for the protection against albuminuria than an overweight or obese BMI.
• The sarcopenic obesity phenomenon is defined by a high visceral adipose tissue in combination with a normal BMI.
• The sarcopenic obesity phenomenon was seen even in earlier eGFR stages in the population of this study.
Declarations
Ethical approval and consent to participate: The study was approved by the Hospital Institutional Review Board with an Institutional Review Board (IRB)/Ethics Committee approval number (A.P:7205). All procedures performed in accordance with the ethical standards of the institutional and/or national research committee and with the 1964 Helsinki declaration and its later amendments or comparable ethical standards. Informed oral consent was obtained from all individual participants included in the study
Consent for publication: I have obtained consent to publish from the participant (or legal parent) to report individual patient data.
Availability of supporting data: No additional data are available.
Funding: This research did not receive any specific grant from funding agencies in the public, commercial, or not-forprofit sectors
Acknowledgements
Financial disclosure: None.
Conflict of interest: The authors have declared that no conflict of interest exists.
Authors’ contributions: Vaia D Raikou: Research plan, data collection, statistical analyses and manuscript writing.
Sotiris Gavriil: Research plan, data collection, approval of written manuscript.
References
- Wang Y, Beydoun MA. The obesity epidemic in the United States—gender, age, socioeconomic, racial/ethnic, and geographic characteristics: A systematic review and metaregression analysis. Epidemiol Rev. 2007; 29: 6-28.
- Chang HC, Yang HC, Chang HY, et al. Morbid obesity in Taiwan: Prevalence, trends, associated social demographics, and lifestyle factors. PLoS One. 2017; 12: e0169577.
- Foster MC, Hwang SJ, Larson MG, et al. Overweight, obesity, and the development of stage 3 CKD: the Framingham heart study. Am J Kidney Dis. 2008; 52: 39-48.
- Flegal KM, Kit BK, Orpana H, Graubard BI. Association of allcause mortality with overweight and obesity using standard body mass index categories: a systematic review and metaanalysis. JAMA. 2013; 309: 71-82.
- Global BMI Mortality Collaboration. Body-mass index and allcause mortality: Individual-participant-data meta-analysis of 239 prospective studies in four continents. Lancet. 2016; 388: 776-786.
- Ladhani M, Craig JC, Irving M, Clayton PA, Wong G, et al. Obesity and the risk of cardiovascular and all-cause mortality in chronic kidney disease: A systematic review and meta-analysis. Nephrol Dial Transplant. 2017; 32: 439-449.
- Sesso RC, Lopes AA, Thomé FS, Lugon JR, Martins CT, et al. Brazilian Chronic Dialysis Survey 2016. J Bras Nefrol. 2017; 39: 261-266.
- Moţa E, Popa SG, Moţa M, et al. Prevalence of chronic kidney disease and its association with cardio-metabolic risk factors in the adult Romanian population: the PREDATORR study. Int Urol Nephrol. 2017; 47: 1831-1838.
- Levey AS, Becker C, Inker LA. Glomerular filtration rate and albuminuria for detection and staging of acute and chronic kidney disease in adults: A systematic review. JAMA. 2015; 313: 837-846.
- Jerums G, Panagiotopoulos S, Premaratne E, MacIsaac RJ, et al. Integrating albuminuria and GFR in the assessment of diabetic nephropathy. (glomerular filtration rate) (Report). Nature Reviews Nephrology. 2009; 5: 397-406.
- Michishita R, Matsuda T, Kawakami S, et al. Kidney Disease (CKD) in middle-aged and older males. Clin Exp Hypertens. 2017; 7: 1-10.
- Hall JE, do Carmo JM, da Silva AA, Wang Z, Hall ME, et al. Obesity-induced hypertension: interaction of neurohumoral and renal mechanisms. Circ Res. 2015; 116: 991-1006.
- William G Herrington, Margaret Smith, Clare Bankhead, Kunihiro Matsushita, Sarah Stevens, Tim Holt FD, et al. Body-mass index and risk of advanced chronic kidney disease: Prospective analyses from a primary care cohort of 1.4 million adults in England. PLoS ONE. 2017; 12: e0173515.
- Lin TY, Liu JS, Hung SC. Obesity and risk of end-stage renal disease in patients with chronic kidney disease: As cohort study. Am J Clin Nutr. 2018; 10.1093/ajcn/nqy200.
- Organization WH. Global recommendations on Physical Activity for health. World Health Organization. 2010.
- Organization WH. BMI classification. Global Database on Body Mass Index: An Interactive Surveillance Tool for Monitoring Nutrition Transition. Geneva: World Health Organization; 2006.
- Consultation WE. Waist Circumference and Waist-hip Ratio. Report of a WHO Expert Consultation Geneva. World Health Organization. 2008; 8-11.
- Alberti G, Zimmet P, Shaw J, Grundy S. IDF Worldwide Definition of the Metabolic Syndrome. International Diabetes Federation (IDF) Avenue Emile de Mot. 2006; 1.
- Kdigo, CKD Work Group KDIGO 2012 clinical practice guideline for the evaluation and management of chronic kidney disease. Kidney Int Suppl. 2013; 3: 1-150.
- Okorodudu DO, Jumean MF, Montori VM, et al. Diagnostic performance of body mass index to identify obesity as defined by body adiposity: A systematic review and metaanalysis. Int J Obes. 2010; 34: 791-799.
- 21. Lim PS, Chen CH, Zhu F, et al. Validating body fat assessment by bioelectric impedance spectroscopy in Taiwanese hemodialysis patients. J Ren Nutr. 2017; 27: 37-44.
- Wang YW, Lin TY, Peng CH, et al. Factors associated with decreased lean tissue index in patients with chronic kidney disease. Nutrients. 2017; 9: 434.
- Park J, Jin DC, Molnar MZ, et al. Mortality predictability of body size and muscle mass surrogates in Asian vs white and African American hemodialysis patients. Mayo Clin Proc. 2013; 88: 479-486.
- Lu JL, Kalantar-Zadeh K, Ma JZ, et al. Association of body mass index with outcomes in patients with CKD. J Am Soc Nephrol. 2014; 25: 2088-2096.
- Lu JL, Molnar MZ, Naseer A, Mikkelsen MK, Kalantar-Zadeh K, Kovesdy CP, et al. Association of age and BMI with kidney function and mortality: A cohort study. Lancet Diabetes Endocrinol. 2015; 3: 704±714.
- Zhang X, Lerman LO. The metabolic syndrome and chronic kidney disease. Transl Res. 2017; 183: 14-25.
- Hsu CC, Chang HY, Huang MC, et al. Association between insulin resistance and development of microalbuminuria in type 2 diabetes: A prospective cohort study. Diab Care. 2011; 34: 982-987.
- Wisse BE. The inflammatory syndrome: The role of adipose tissue cytokines in metabolic disorders linked to obesity. J Am Soc Nephrol. 2004; 15: 2792-2800.
- Gluba A, Mikhailidis D, Lip GYH, Hannam S, Rysz J, Banach M, et al. Metabolic syndrome and renal disease. Inter J Cardiol. 2013; 164: 141-150.