
SciBase Journals
SciBase Epidemiology and Public Health
ISSN 2996-4555
- Article Type: Research Article
- Volume 2, Issue 2
- Received: Mar 27, 2024
- Accepted: Apr 23, 2024
- Published Online: Apr 30, 2024
Study on the Structure of Sputum Flora in Silicosis Patients with Different Stages
Tao Liu*
Shenzhen Campus, Sun Yat-Sen University, 66 Gongchang Road, Guangming District, Shenzhen, 528406, China.
*Corresponding Author: Tao Liu
Shenzhen Campus, Sun Yat-Sen University, 66 Gongchang Road, Guangming District, Shenzhen, 528406, China.
Email: 915400976@qq.com
Abstract
Silicosis is a serious respiratory disease, which causes great harm to human health. Silicosis patients due to long-term exposure to silica dust particles, may lead to the imbalance of bacterial flora in the respiratory tract, thereby increasing the risk of respiratory infection. In this study, sputum samples from inpatients with silicosis at different stages in a hospital in Chengdu were collected, the genome was extracted, the sputum sample genome was sequenced by high-throughput sequencing technology, and the microflora composition of sputum samples was obtained by using QIIME 1.8.0 for analysis, including OTUs analysis, Alpha diversity analysis, Beta diversity analysis, etc. Then, the structure of respiratory microflora in silicosis patients was analyzed, and the composition, distribution and diversity of microflora in sputum of silicosis patients with different stages were compared. The results showed that the sputum flora of silicosis patients were firmicutes, Proteobacteria, Bacteroidetes, actinobacteria and clostridium, which were consistent with those of healthy people. However, there were differences in the placement of dominant bacteria in silicosis patients with different stages. Therefore, the study of sputum flora structure of silicosis patients with different stages is helpful to further understand the pathophysiological process of silicosis, and provide a more in-depth theoretical basis for the prevention, early diagnosis and treatment of silicosis.
Keywords: Silicosis; 16sRNA; Rputum flora; Diversity analysis; Occupational disease.
Citation: Liu T. Study on the Structure of Sputum Flora in Silicosis Patients with Different Stages. SciBase Epidemiol Public Health. 2024; 2(2): 1024.
Introduction
Pneumoconiosis (pneumoconiosis) is a long-term inhalation of productive dust in occupational production activities, and retention in the lung, resulting in diffuse fibrosis of lung tissue based systemic disease, also known as pneumoconiosis. silicosis is one of the most common pneumoconiosis, which is a disease in which people breathe a large amount of dust containing free silica in production and life, leading to extensive nodules fibrosis in the lungs and causing lesions in other parts of the body. Silicosis has a long course of disease and is very harmful to human health and quality of life. Although the prevention and control of silicosis has been strengthened, its incidence is still not optimistic.
The pathogenesis of silicosis is related to many factors, such as dust concentration, contact time and body status, etc. The pathogenesis is not very clear at present, and whether the change of respiratory tract flora structure is related to the disease has attracted wide attention. In the study of respiratory bacteria in silicosis patients, the traditional culture method was used to isolate and culture bacteria, but due to the long culture time, and there are many kinds of respiratory bacteria, and many bacteria can not be cultured, can not fully grasp the types and quantities of respiratory bacteria. With the emergence of new techniques and methods in modern molecular biology, especially the development and popularization of high-throughput sequencing technology, it is possible to study the structure of bacterial flora.
Hilty et al. National Heart and Lung Institute of Imperial College London, were the first to use sequencing technology to study respiratory tract flora. In 2010, they used 16sRNA sequencing technology to analyze specimens obtained in the lung bronchus and proved for the first time that a large number and variety of microbial colonies existed in the lower respiratory tract of the human body [1]. Then in 2011, Charlson et al. from the University of Pennsylvania in the United States used DNA barcoding, Q-PCR, and 454 sequencing technology to systematically analyze the structure of microbial flora at the vertical level of the entire respiratory tract for the first time [2]. According to the study of Blainey et al. the main microbial groups in the respiratory tract of healthy people include Firmicutes, Bacteroides, Proteobacteria, actinobacteria and clostridium [3]. Subsequently, scholars began to explore the structural differences of respiratory tract flora in disease states.
In recent years, studies on the structural differences of respiratory tract microflora under disease conditions have included studies on the microflora structure of pulmonary cystic fibrosis, COPD, asthma and other diseases, and found that the structure of respiratory tract microflora of these diseases is different from that of healthy people [4-7]. However, how does the structure of respiratory tract microflora of silicosis patients change? Is there any difference in the structure of respiratory tract flora in people with different stages of silicosis? No reports have been reported at home and abroad. Therefore, sputum samples of patients with respiratory tract infection in different stages of silicosis and non-silicosis will be collected for study. Although sputum, nasopharyngeal aspirates and bronchoalveolar lavage fluids can be used in the study of respiratory microflora structure, sputum samples are the easiest to collect, and many studies have collected sputum for analysis, such as Molyneaux P L et al. ‘s study of respiratory microflora structure in patients with chronic obstructive pulmonary disease and pulmonary cystic fibrosis. It was the sputum bacteria analyzed, and it was found that the biological characteristics of microbial flora in the lower respiratory tract were basically not affected by bacterial pollution in the upper respiratory tract [8-11]. Therefore, sputum samples were still used in this study to extract DNA for sequence determination.
In this study, a certain amount of samples were selected from sputum samples of silicosis patients according to different stages to extract DNA, and 16sRNA gene sequence analysis was carried out to obtain the structure of sputum flora of silicosis patients with different stages, and the differences were analyzed in order to understand the characteristics of respiratory flora of silicosis patients with different stages. In addition, a preliminary comparison was made with the microflora of non-silicosis patients with respiratory tract infection, and the comparative analysis of the differences in microflora structure may find the effect of the changes in the microflora of these patients with respiratory tract infection. In recent years, there have been many reports on the effect of using microbial therapy to treat diseases. For example, children with asthma improved their lung function by taking probiotic capsules containing lactobacillus and bifidobacterium. Intake of probiotics can reduce the infection rate of the upper respiratory tract. Therefore, it is worth discussing whether the health status of silicosis patients can be improved by regulating respiratory flora. The study on the structure of respiratory flora of patients can provide scientific basis for this treatment. Therefore, this study studied the structure of respiratory tract microflora in patients with different stages of silicosis, understood the biological characteristics of silicosis from different angles, and actively explored the role of related factors, in an attempt to accumulate data for reducing the harm of respiratory tract infection to silicosis patients by regulating microbial flora.
Material and methods
Material source
Sputum samples and related clinical data of silicosis patients with different stages in a hospital in Chengdu of China.
Collection of sputum samples
Natural sputum sputum was used for specimen collection: morning sputum was used. After the patient got up in the morning, he rinsed with water, and then forcibly coughed out the sputum deep in the trachea, which was directly stored in a sterile sputum cup at -80OC.
Collection of relevant clinical information
The patient’s clinical data include: name, gender, home address, occupation, symptoms, signs, laboratory tests, preliminary diagnosis results, etc.
Screening of experimental specimens
Sputum samples of silicosis patients with different stages and samples used in control group were selected from silicosis patients. The selection factors included gender, age, antibiotic use and other diseases. The structure of respiratory tract microflora is diverse [12-14]. Changes in the structure of respiratory tract microflora have also been reported in many respiratory diseases [15-17]. Not only the disease itself has an impact on the structure of respiratory tract microflora, but also some other factors, such as age, smoking, host genes, time changes, etc. Use of antibiotics, etc. [18-25]. Therefore, this study will try its best to exclude the influence of these factors in sample screening.
Genome extraction of sputum specimen
A PowerSoil DNA Isolation Kit (MOBIO) was used for genome extraction of sputum samples. 500µL sputum sample was added into Powerbead Tube and then mixed with swirls. Add 60 µL Solution C1 (cracking buffer) and swirl well. Install the vortex adapter and swirl at the maximum speed for 10 min. Centrifuge at 10,000 g for 30 s and transfer 500 µL supernatant to a 2 mL centrifuge tube. Add 250 µL Solution C2 (inhibitor removal liquid-1), swirl for 5 s, and place at 40OC for 5 min. Centrifuge at 10,000 g for 1 min and transfer 400 µL of supernatant to a 2 mL centrifuge tube. Add 200 µL Solution C3 (inhibitor removal liquid-2), swirl and place at 40OC for 5 min. Centrifuge at 10,000 g for 1 min and transfer no more than 500 µL of supernatant to a 2 mL centrifuge tube. Add 1200 µL of shaken Solution C4 (high salt solution) and swirl for 5 s. 600 µL supernatant was transferred to the Spin Filter, centrifuged at 10,000 g for 1 min, and the filtrate was poured out and the remaining liquid was transferred and centrifuged. Add 500 µL Solution C5 (leaching buffer), centrifuge at 10,000 g for 30 s, drain the leach solution, centrifuge at 10,000 g for 1 min. Put the Spin Filter into a new collection tube and add 100 µL Solution C6 (DNA eluent) to the center of the white filter. Centrifuge at 10,000 g for 30 s, DNA was collected and stored at -20OC.
Sequencing analysis of 16sRNA V3V4 gene in sputum genome
Genome quality detection: A microspectrophotometer (Nanodrop2000c, Thermo) was used to detect the concentration and purity of the extracted sputum genome.
16sRNA library preparation: Take 10 ng DNA template and amplify the target region: V3+V4 region primer 341F-805R, primer sequence is as follows:
341F primer:
CCCTACACGACGCTCTTCCGATCTGCCTACGGGNGGCWGCAG
805R primer:
GACTGGAGTTCCTTGGCACCCGAGAATTCCAGACTACHVGGGTATCTAATCC
Library detection: After the library construction was completed, Qubit2.0 was used for preliminary quantification, and the library was diluted to 1 ng/µL. Then Agilent 2100 was used to detect the insert size of the library. After the insert size met the expectation, Bio-RAD CFX 96 fluorescent quantitative PCR instrument was used. Bio-RAD KIT iQ SYBR GRN performs QPCR to accurately quantify the effective concentration of the library to ensure the quality of the library.
Sequencing: Qualified libraries were sequenced by Miseq, and the sequencing strategy was PE250. The experimental process was as follows: extraction of genomic DNA of sample - amplification of highly variable region and purification of product - enrichment of target fragment and purification of product - end repair, addition of splice - library check - sequencing.
Gene information analysis: For the sequence obtained by sequencing, the process of removing low-quality base, Ns, and joint contamination sequence was completed to filter the data, and the target sequence was obtained for subsequent analysis. The filtered sequences are called Clean Reads. First, the corresponding Read1 and Read2 of double-ended sequencing (Read1 and Read2 refer to the sequence fragments sequenced from the 5 ‘and 3’ ends, respectively) were spliced using the sequence splicing method PEAR. Then, the spliced sequences were analyzed using software QIIME 1.8.0 [26-28], including OTUs cluster analysis, Lefse analysis, Alpha diversity analysis, Beta diversity analysis, etc. [29].
Result
Information about included silicosis patients
A total of 24 patient samples were included in this study, including 6 cases of stage I silicosis (G1-G1-6), 6 cases of stage II silicosis (G2-1-G2-6), 7 cases of stage III silicosis (G3-1-G3-7), and 5 cases of control group (C1-C5). The relevant information of the specimens of 24 patients is as follows [1-3]:
The quality of genomic DNA
NanoDrop 2000 measures the concentration and purity of a sample’s genome. It can be seen that the quality of the samples meets the requirements of sequencing. As shown in Table 4:
Table 1: Patient related information.
| Sample | Sex | Age | Diagnosis | Cigarette and Wine |
|---|---|---|---|---|
| G1-1 | Male | 50 | Stage I silicosis; Lung infection; Emphysema | Cigarettes: 20 cigarettes/day, 30 years, Wine: None |
| G1-2 | Male | 56 | Stage I silicosis; Lung infection; Emphysema | Cigarettes: 10 cigarettes/day, 30 years, Wine: 250 mL/day |
| G1-3 | Male | 39 | Stage I silicosis; Lung infection; Emphysema | Cigarettes: Seven years, Wine: 4 years |
| G1-4 | Male | 46 | Stage I silicosis; Lung infection; Emphysema | Cigarettes:20-30 cigarettes/day, 20 years, Wine: 300 ml/ day, 20 years |
| G1-5 | Male | 50 | Stage I silicosis; Lung infection; Emphysema | Cigarettes: 20 cigarettes/day, 20 years, Wine: Less, 20 years |
| G1-6 | Male | 65 | Stage I silicosis; Lung infection; Emphysema | Cigarettes: 20 cigarettes/day, 40 years, Wine: Less |
| G2-1 | Male | 77 | Stage II silicosis; Lung infection; emphysema | None |
| G2-2 | Male | 50 | Stage II silicosis; Lung infection; emphysema | Cigarettes: 20 cigarettes/day, 10 years, Wine: None |
| G2-3 | Male | 48 | Stage II silicosis; Lung infection; emphysema | Cigarettes: 20 cigarettes/day, 20 years, Wine: 150 ml/ day, 20 years |
| G2-4 | Male | 66 | Stage II silicosis; Lung infection; emphysema | None |
| G2-5 | Male | 39 | Stage II silicosis; Lung infection; emphysema | Cigarettes: 20 cigarettes/day, 10 years, Wine: Less |
| G2-6 | Male | 67 | Stage II silicosis; Lung infection; emphysema | Cigarettes: 30 cigarettes/day, 20 years, Wine: 150 ml/ day, 10 years |
| G3-1 | Male | 41 | Stage III silicosis; Lung infection; emphysema | Cigarettes: 20 cigarettes/day, 10 years, Wine: None |
| G3-2 | Male | 59 | Stage III silicosis; Lung infection; emphysema | Cigarettes: 10 cigarettes/day, 10 years, Wine: None |
| G3-3 | Male | 49 | Stage III silicosis; Lung infection; emphysema | Cigarettes: 20 cigarettes/day, 11 years, Wine: None |
| G3-4 | Male | 46 | Stage III silicosis; Lung infection; emphysema | Cigarettes: 20 cigarettes/day, 10 years, Wine: None |
| G3-5 | Male | 51 | Stage III silicosis; Lung infection; emphysema | Cigarettes: None, Wine: Less |
| G3-6 | Male | 46 | Stage III silicosis; Lung infection; emphysema | Cigarettes: 20 cigarettes/day, 20 years, Wine: Less |
| G3-7 | Male | 40 | Stage III silicosis; Lung infection; emphysema | None |
| C-1 | Male | 78 | Lung infection | Cigarettes: 20 cigarettes/day, 10 years, Wine: 150 ml/ day, 10 years |
| C-2 | Male | 72 | Lung infection | Cigarettes: 10 cigarettes/day, 20 years, Wine: None |
| C-3 | Male | 83 | Lung infection | None |
| C-4 | Male | 61 | Lung infection | None |
| C-5 | Male | 60 | Lung infection | Cigarettes: 4 cigarettes/day, 10 years, Wine: Less |
Table 2: Patient related clinical information.
| Sample | Symptom | Physical Examination | |||
|---|---|---|---|---|---|
| Temperature (OC) | Respiratory rate (Times/minute) |
Blood pressure (mmHg) |
Blood pressure (Times/ minute) |
||
| G1-1 | Cough, phlegm, shortness of breath | 36.5 | 21 | 115/73 | 89 |
| G1-2 | Cough, phlegm, shortness of breath | 36.6 | 21 | 124/77 | 67 |
| G1-3 | Cough, chest pain | 36.8 | 21 | 136/88 | 79 |
| G1-4 | Cough, phlegm | 36.8 | 21 | 106/73 | 73 |
| G1-5 | Cough, phlegm | 36.5 | 21 | 112/76 | 74 |
| G1-6 | Cough, phlegm, shortness of breath | 37.1 | 22 | 85/53 | 78 |
| G2-1 | Cough, phlegm, shortness of breath | 36.7 | 21 | 119/79 | 107 |
| G2-2 | Chest pain, heart fatigue, tight breath | 37 | 21 | 128/87 | 85 |
| G2-3 | Cough, phlegm, shortness of breath | 36.7 | 20 | 102/67 | 98 |
| G2-4 | Cough, phlegm | 36.5 | 22 | 121/55 | 133 |
| G2-5 | Cough, phlegm, shortness of breath | 36.3 | 22 | 104/73 | 122 |
| G2-6 | Cough, phlegm, shortness of breath | 36 | 21 | 96/60 | 88 |
| G3-1 | Cough, phlegm, shortness of breath | 36.2 | 21 | 124/82 | 86 |
| G3-2 | Cough, phlegm, shortness of breath | 36.7 | 23 | 187/107 | 84 |
| G3-3 | Shortness of breath | 36.5 | 22 | 112/85 | 85 |
| G3-4 | Cough, phlegm, shortness of breath | 36.7 | 21 | 122/82 | 68 |
| G3-5 | Cough, phlegm, shortness of breath | 36.6 | 21 | 120/91 | 69 |
| G3-6 | Cough, phlegm, shortness of breath | 36.6 | 21 | 104/50 | 81 |
| G3-7 | Cough, phlegm, shortness of breath, chest tightness | 36.6 | 20 | 124/90 | 109 |
| C-1 | Cough, phlegm, heart tired, tight breath | 37 | 20 | 90/60 | 88 |
| C-2 | Fever, cough | 38 | 22 | 124/73 | 84 |
| C-3 | Left hemiplegia, disturbance of consciousness | 36.4 | 22 | 106/68 | 79 |
| C-4 | disturbance of consciousness | 36.4 | 20 | 104/78 | 98 |
| C-5 | Cough, phlegm, shortness of breath | 36.7 | 21 | 145/63 | 108 |
Table 3: Patient laboratory test information.
| Sample | Laboratory tests (blood) | |||||||
|---|---|---|---|---|---|---|---|---|
| WBC (x1012/L) | RBC (x109%L) | L (x109%L) | N (%) | L(%) | Hb (g/L) | PLT (x109%L) | Microbial infection | |
| G1-1 | 9.9 | 4.57 | 1.7 | 72.5 | 17.3 | 144 | 183 | None |
| G1-2 | 4.9 | 4.64 | 1.71 | 52.3 | 34.7 | 148 | 136 | None |
| G1-3 | 4.9 | 4.71 | 1.6 | 5.3 | 13.4 | 132 | 59 | Rhinovirus PIV2 |
| G1-4 | 6.4 | 5.3 | 2.08 | 54.2 | 32.6 | 167 | 227 | None |
| G1-5 | 3.7 | 4.56 | 0.78 | 69.0 | 21.4 | 146 | 117 | None |
| G1-6 | 6.5 | 4.07 | 0.65 | 80.6 | 9.9 | 113 | 159 | None |
| G2-1 | 4.5 | 3.71 | 1.27 | 58.7 | 28.4 | 114 | 158 | None |
| G2-2 | 5.6 | 5.5 | 2.4 | 50.3 | 43.1 | 165 | 201 | None |
| G2-3 | 6.1 | 5.2 | 0.97 | 71.3 | 16.0 | 144 | 311 | None |
| G2-4 | 10.6 | 5.19 | 2.05 | 71.7 | 19.3 | 157 | 214 | Candida albicans |
| G2-5 | 5.9 | 5.44 | 1.77 | 60.5 | 30.0 | 169 | 151 | None |
| G2-6 | 7.6 | 5.09 | 1.4 | 64.9 | 18.4 | 147 | 145 | None |
| G3-1 | 4.8 | 5.42 | 1.43 | 61.3 | 30.0 | 151 | 228 | None |
| G3-2 | 4.9 | 5.25 | 1.21 | 62.0 | 24.6 | 157 | 206 | None |
| G3-3 | 7.5 | 4.6 | 1.93 | 67.2 | 25.8 | 131 | 193 | Klebsiella pneumoniae |
| G3-4 | 6.3 | 4.94 | 2.05 | 57.1 | 32.7 | 152 | 224 | None |
| G3-5 | 4.4 | 4.39 | 1.5 | 55.0 | 34.5 | 136 | 144 | Adenovirus |
| G3-6 | 7.8 | 5.24 | 1.26 | 74.5 | 16.3 | 134 | 373 | Rhinovirus |
| G3-7 | 4.8 | 5.09 | 0.91 | 69.8 | 18.9 | 142 | 154 | None |
| C-1 | 10.5 | 3.64 | 2.7 | 66.7 | 25.7 | 110 | 253 | E. coli |
| C-2 | 4.8 | 3.96 | 0.98 | 63.8 | 20.0 | 128 | 114 | None |
Table 4: Sample quality.
| Sample | Concentration (ng/μL) | OD260/280 |
|---|---|---|
| G1-1 | 202.00 | 1.85 |
| G1-2 | 177.20 | 1.87 |
| G1-3 | 349.56 | 1.92 |
| G1-4 | 390.00 | 1.90 |
| G1-5 | 478.60 | 1.88 |
| G1-6 | 300.00 | 1.79 |
| G2-1 | 410.24 | 1.90 |
| G2-2 | 255.88 | 1.80 |
| G2-3 | 334.90 | 1.78 |
| G2-4 | 457.00 | 1.95 |
| G2-5 | 336.87 | 1.90 |
| G2-6 | 266.45 | 1.89 |
| G3-1 | 347.80 | 1.84 |
| G3-2 | 400.50 | 1.88 |
| G3-3 | 427.20 | 1.90 |
| G3-4 | 320.24 | 2.00 |
| G3-5 | 354.66 | 1.89 |
| G3-6 | 405.20 | 1.85 |
| G3-7 | 330.21 | 1.99 |
| C-1 | 385.40 | 1.87 |
| C-2 | 260.70 | 1.81 |
| C-3 | 277.58 | 1.89 |
| C-4 | 410.90 | 1.78 |
| C-5 | 270.00 | 1.80 |
Table 5: Summary statistics of OTUs numbers.
| Sample | Normalized Tags |
Total Aligned Tags |
Aligned Rate (%) | Total OTUs Number |
|---|---|---|---|---|
| G1-1 | 48001 | 35536 | 74.03 | 104 |
| G1-2 | 48001 | 28671 | 59.73 | 138 |
| G1-3 | 48001 | 31542 | 65.71 | 129 |
| G1-4 | 48001 | 26313 | 54.82 | 143 |
| G1-5 | 48001 | 23733 | 49.44 | 129 |
| G1-6 | 48001 | 25510 | 53.14 | 146 |
| G2-1 | 48001 | 28373 | 59.11 | 47 |
| G2-2 | 48001 | 28134 | 58.61 | 120 |
| G2-3 | 48001 | 30659 | 63.87 | 117 |
| G2-4 | 48001 | 25393 | 52.9 | 51 |
| G2-5 | 48001 | 28259 | 58.87 | 130 |
| G2-6 | 48001 | 27263 | 56.8 | 64 |
| G3-1 | 48001 | 25784 | 53.72 | 124 |
| G3-2 | 48001 | 27305 | 56.88 | 146 |
| G3-3 | 48001 | 23423 | 48.8 | 135 |
| G3-4 | 48001 | 23593 | 49.15 | 139 |
| G3-5 | 48001 | 28543 | 59.46 | 132 |
| G3-6 | 48001 | 29319 | 61.08 | 119 |
| G3-7 | 48001 | 27583 | 57.46 | 145 |
| C-1 | 48001 | 38365 | 79.93 | 54 |
| C-2 | 48001 | 27562 | 57.42 | 84 |
| C-3 | 48001 | 27968 | 58.27 | 68 |
| C-4 | 48001 | 31722 | 66.09 | 44 |
| C-5 | 48001 | 28305 | 58.97 | 101 |
Note: (1) Normalized Tags: The number of normalized sequences after normalization. (2) Total Aligned Tags: The total number of sequences aligned with the reference database; (3) Aligned Rate(%): Alignment rate, that is, the proportion of aligned sequences to the total spliced sequences; (4) Total OTUs Number: indicates the number of all OTUs.

OTUs analysis
OTUs statistics: OTUs, that is, classification operation unit, represents a set of similar sequences. Tags with sequence similarity greater than 97% are classified into a class of OTUs, believing that they have the same species origin. Representative sequences selected from them can simplify the data set for further analysis. The method of selecting OTUs is to compare the obtained sequences with the OTUs sequences in the reference database, and select the sequences whose similarity is greater than 97% to belong to a class of OTUs. Species identification is based on the corresponding identification sequence of each species in the database and the results of the selected OTUs. OTUs whose sequence number is less than 2 in all samples will be excluded to eliminate the influence of some OTUs with low reliability on subsequent analysis. The summary statistics of OTUs numbers are shown in Table 5:
OTUs statistical heat map: The number of sequences belonging to different OTUs in each sample was counted, and the result was displayed by heat map, which can show the OTUs changes among samples, as shown in Figure 1.
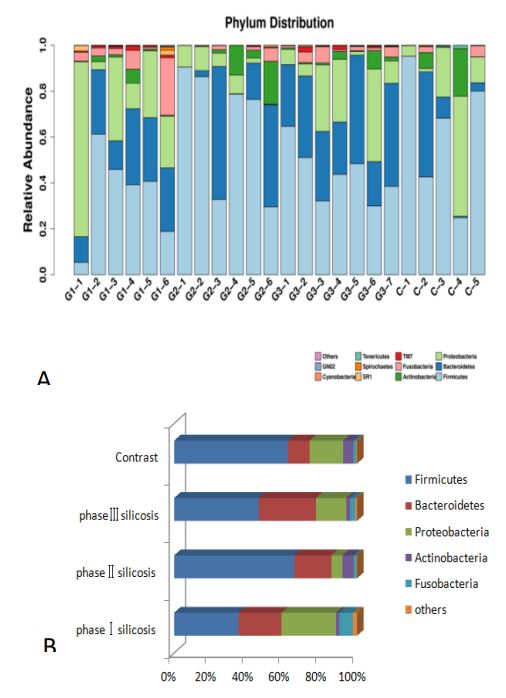
Species distribution: Since there are many different OTUs of the same species, combining OTUs with the same species classification and counting the species composition changes between different samples can understand the flora diversity of different samples. The following bar chart (Figure 2) shows the species distribution in each sample at the phylum level and the main phyla of silicosis in different stages:
It can be seen that Firmicutes, Bacteroides, Proteobacteria, actinomycetes and clostridium are the five main bacterial groups in the respiratory tract of silicosis patients, and Firmicutes are still the main bacterial groups in the respiratory tract of silicosis patients. 1) Compared with the control group, the proportion of Firmicutes in stage I and III silicosis patients is lower (P<0.01). The proportion of bacteroidetes in the third stage silicosis patients was higher (P<0.01). The proportion of Proteobacteria in stage II silicosis patients was higher (P<0.01). 2) The firmicutes content in stage II silicosis patients was higher than that in stage I and Stage III silicosis patients (P<0.01); The incidence of Bacteroidetes in stage III silicosis patients was higher than that in stage II silicosis patients (P<0.01). The content of Proteobacteria in stage I silicosis was higher than that in Stage III silicosis (P<0.01), Stage III silicosis was higher than that in stage II silicosis (P<0.01). Actinomycetes and clostridium showed little change in silicosis patients (P=0.169, P=0.167).
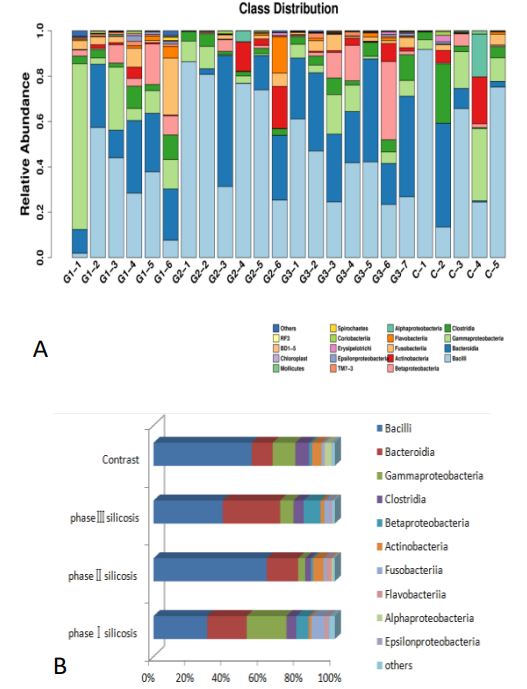
At the class level, the species distribution of samples and the main bacterial classes of silicosis in different stages are shown below (Figure 3).
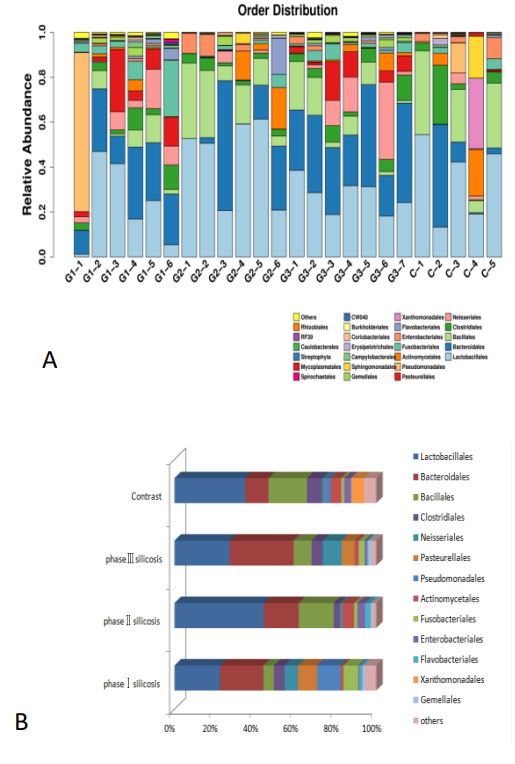
It can be concluded that: 1) Compared with the control group, the proportion of bacillus in Firmicutes in stage I and III silicosis patients was lower (P<0.01); Bacteroidetes in Bacteroidetes accounted for a higher proportion in the third stage silicosis patients (P<0.01). The level of α-Proteobacteria in silicosis patients was higher than that in control group (P<0.01). 2) Compared with the silicosis patients of different periods, the spore-type bacteria of the first and third stage silicosis patients were lower than that of the second stage silicosis patients (P<0.01); The content of γ-Proteobacteria in Stage I silicosis was higher than that in stage II and III silicosis (P<0.01). The content of β-Proteobacteria in stage II silicosis patients was lower than that in stage I and III silicosis patients (P<0.01). There were no changes in actinomycetes and clostridium bacteria in Actinomycetes (P=0.169, P=0.167). The species distribution of samples at the order level and the main bacteriales of silicosis in different stages are shown below (Figure 4).
The results showed that: 1) Compared with the control population, the proportion of bacillus orders in stage I and III silicosis patients was lower (P<0.01); The twinobacteriales were increased in the patients with stage III silicosis (P<0.01). The proportion of Bacteroidees in the third stage silicosis patients was higher (P<0.01). The Neisseria of β-Proteobacteria accounted for a higher proportion in the third stage silicosis patients (P<0.01). Among the gamma-Proteobacteria, the proportion of Pasteurella in the first stage silicosis patients was higher (P<0.01), while the proportion of xanthosphaera in the third stage silicosis patients was lower (P<0.01). The proportion of pseudomonas in stage II and III silicosis patients was low (P<0.01). 2) The level of Lactobacilli in stage II silicosis patients was higher than that in stage I and Stage III silicosis patients (P<0.01); The patients with stage II silicosis were higher than those with stage I (P<0.01). The incidence of Neisseria in stage I and III silicosis patients was higher than that in stage II silicosis patients (P<0.01). The content of pseudomonas gamma-proteobacteria in primary silicosis patients was higher than that in secondary and tertiary silicosis patients (P<0.01). Actinomycetes and Fusobacteriales did not change much in silicosis patients (P=0.169, P=0.167).
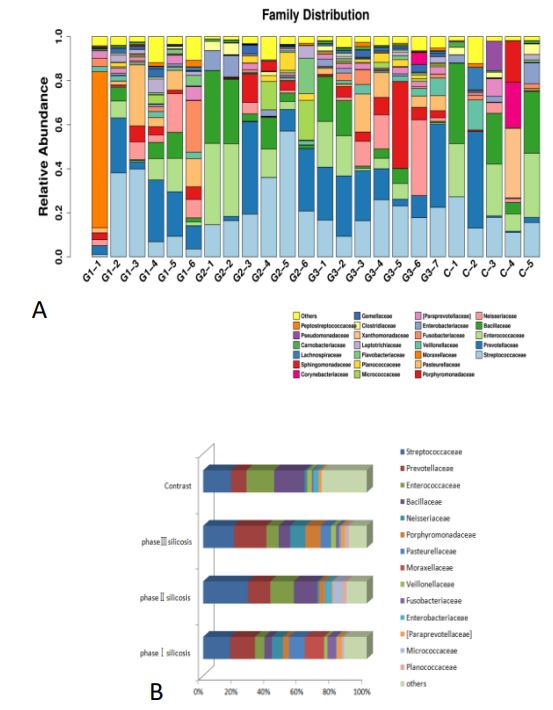
The distribution of sample species at the family level and the main bacteriaceae in different stages of silicosis (Figure 5).
It can be concluded that, 1) Compared with the control group, the proportion of bacillaceae in stage I and III Silicosis patients was lower (P<0.01), while the proportion of Veillonaceae in Clostridium groups was lower in stage II silicosis patients (P<0.01), and the proportion of bacteroideoideae in Stage III silicosis patients was higher (P<0.01). The proportion of Neisseraceae bacteria in stage III silicosis patients was higher (P<0.01), the proportion of Pasteurella bacteria in stage I silicosis patients was higher (P<0.01), the proportion of Moraxeaceae in stage I silicosis patients was higher (P<0.01), and the proportion of acticococcaceae bacteria in stage II silicosis and Stage III silicosis patients was increased (P<0.01). 2) Compared with silicosis patients of different periods, the content of Veillonaceae in stage I silicosis and Stage III Silicosis patients was higher than that in stage II silicosis patients (P<0.01), the content of neisseraceae in stage III silicosis patients was higher than that in stage II silicosis patients (P<0.01), and the content of Pasteurelliaceae in stage I silicosis patients was higher than that in stage II silicosis patients (P<0.01). The incidence of Moraxella in stage I silicosis patients was higher than that in stage II and III silicosis patients (P<0.01), and the incidence of motococcaceae in stage I silicosis patients was lower than that in stage II and III silicosis patients (P<0.01).
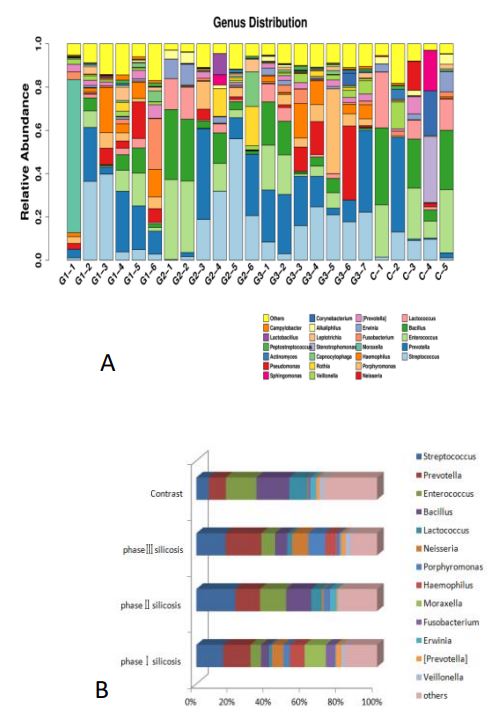
The species distribution of samples at the genus level and the main bacterial genera of silicosis in different stages (Figure 6).
It can be concluded that, 1) Compared with the control group, the proportion of Bacillus bacteria in stage I silicosis patients was lower (P<0.01), the proportion of purpuromonas and Neisseria bacteria in stage III silicosis patients was higher (P<0.01), and the proportion of haemophilus bacteria in stage I silicosis patients was higher (P<0.01). The content of Moraxella was higher in stage I silicosis patients (P<0.01). 2) The content of Neisseria in stage III silicosis patients was higher than that in stage II silicosis patients (P<0.01), and the content of Moraxella in stage I silicosis patients was higher than that in stage II and III silicosis patients (P<0.01).
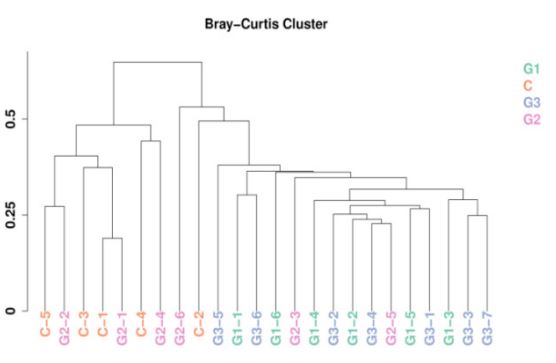
Sample clustering tree diagram: After the species distribution data of the obtained samples were standardized, the BrayCurtis distance value was calculated, and the hierarchical clustering algorithm was used to cluster the samples. The similarity between samples and the existence of outliers can be seen by cluster analysis. The sample clustering tree obtained by calculating this distance is shown below (Figure 7). It can be seen that the Bray-Curtis distance value of the sample in this study is about 0.2-0.7, and no extreme situation occurs. The 24 samples were divided into two categories, while G1 and G3 were closer, G2 and C were more similar.
Diversity analysis
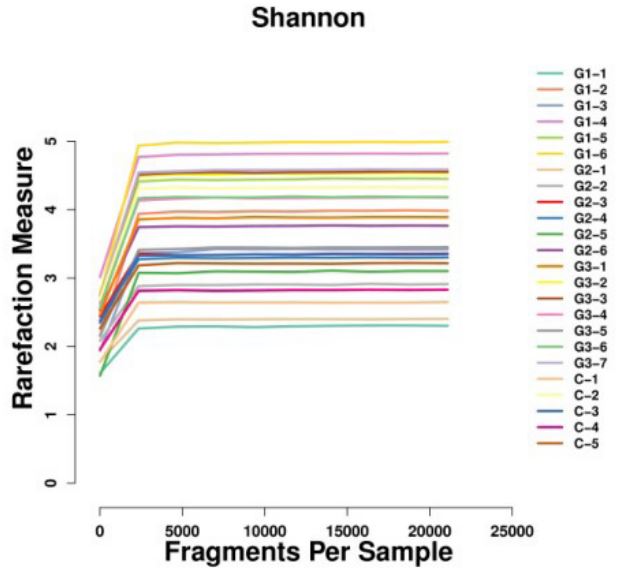
Alpha diversity analysis: Alpha diversity shows the diversity of the flora in the sample, including the richness of the species and the evenness of the number of species. The higher the Alpha diversity, the more abundant the bacterial species, and the more uniform the bacterial number, the more stable the community. Shannon Index: It is a diversity Index calculated according to the species in the sample and the proportion of each species. The relationship between Shannon Index value and sample depth is shown in the figure below (Figure 8). It can be seen that the sample strains used for sequencing in this study are evenly distributed and of good quality. In addition, the Shannon Index of the four groups was 4.0, 3.1, 4.2, and 3.3, respectively, with no statistical significance.
Beta diversity analysis
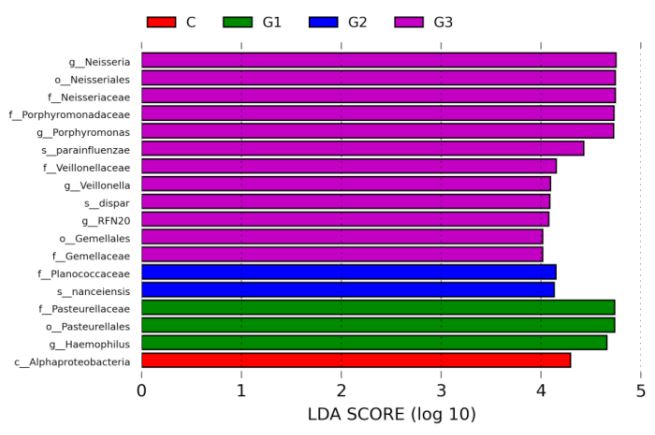
LefSe analysis: LefSe analysis combined linear discriminant analysis with KW rank sum test and Wilcox test to determine the effect size of different species on the difference between groups. Finally, linear discriminant analysis was used to reduce the data and evaluate the influence of species with significant differences. The LDA SCORE (LDA Score) is used to find out some species that are specific between groups or have a greater impact on community structure. It can be seen that the bacterial community types of the third stage silicosis patients have a great impact on the difference between groups; The different groups of bacteria were Neisseria, Twinella, Pasteurella, Violonadaceae, Veillonaceae, Motococcaceae, Neisseria, Pasteurella, Hemophilus, Veisseria, Violonadella, Neisseria, etc. The histogram of LDA value distribution is as follows (Figure 9):
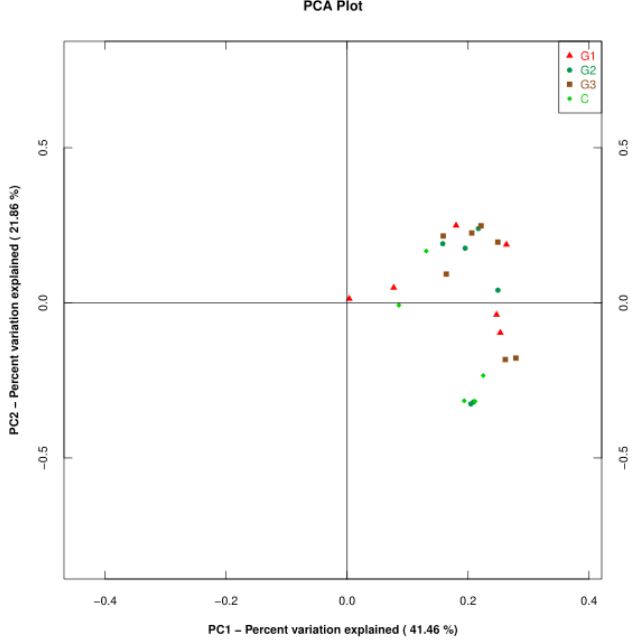
PCA principal component analysis: Beta diversity shows the difference of flora between samples. Principal Component Analysis (PCA) is a method of analyzing and simplifying data. It is often used to reduce the dimension of a data set, while maintaining the features that contribute the most to the difference in the data set, so as to extract the most important elements and structures in the data. The results of PCA are used to extract a few axes that can reflect the differences between samples to the greatest extent, and the differences of multidimensional data can be reflected on the two-dimensional coordinate map by mapping. If the community composition of the samples is more similar, the distance between them in the PCA diagram is closer. The distribution of the samples in principal component 1 and 2 is shown in the figure below (Figure 10). It can be seen that the consistency of the groups is not high, the difference between the groups is not very obvious, and the number of samples needs to be improved.
Discussion
In this study, for the first time, the differences in microflora structure between silicosis patients with different stages and control patients were preliminically discussed. 19 silicosis patients with different stages and 5 control patients were selected as research objects. Although the top five microflora of these patients were Firmicutes, Proteobacteria, Clostridium, bacteroides and actinomyces, the ranking of their dominant microflora was different: Firmicutes and Proteobacteria are the dominant bacteria groups in stage I silicosis patients; Firmicutes and bacteroides are the dominant bacteria groups in stage II silicosis patients; Firmicutes and Proteobacteria are the dominant bacteria groups in stage III silicosis patients; and Firmicutes occupy a greater advantage in stage II silicosis patients, accounting for 65.7381%. Interestingly, The bacteria structure of stage II silicosis patients was similar to that of the control group, and firmicutes also had a greater advantage in the control group, accounting for 62.2172%. It can be seen that compared with the control group, the rank of Bacteroidetes in the second and third stages was advanced, from the third to the second. The major change was in secondary silicosis patients, whose firmicutes increased while proteobacteria decreased. In addition, compared with the bacterial community structure in the sputum of silicosis patients and CF patients, Bacteroidetes accounted for a higher proportion, while actinobacteria accounted for a lower proportion. In addition, this study also found no difference in the proportion of actinobacteria and clostridium in each stage of silicosis patients.
After analyzing the structure of sputum bacteriae in silicosis patients of different stages, it was found that the dominant bacteriae in silicosis patients of different stages were spore-bacilli and Bacteroideae. Compared with the control group, the proportion of spore-bacilli in silicosis patients of stage I and III was lower. Bacteroides accounted for a high proportion of patients with stage III silicosis. Compared with the silicosis patients of different periods, the spore-type bacteria of the first and third stage silicosis patients were lower than that of the second stage silicosis patients. The content of γ-Proteobacteria in stage I silicosis patients was higher than that in stage II and III silicosis patients. In this study, it was found that the dominant bacteriae in silicosis patients were mainly Bacillus, Bacteroideae and gamma-Proteobacteria. In addition, it was also found that there was no difference in the proportion of actinomycetes and Fusobacteriae in any stage silicosis patients.
After analyzing the structure of sputum bacteriales in patients with different stages of silicosis, it was found that different bacteriales had different predominance in patients with different stages of silicosis. The dominant bacteriales in patients with stage I silicosis were Lactobacilli, Bacteroidei and Pseudomonas, while the dominant bacteriales in Stage II silicosis were Lactobacilli, Bacteroidei and Bacillus, and the dominant bacteriales in Stage III silicosis were Lactobacilli. Bacteroidei and Bacillus, so it is speculated that Lactobacilli may be the dominant bacteriales in silicosis patients. Similarly, there was no difference in the proportion of actinomycetes and Fusobacteriaceae in any stage of silicosis.
The analysis of the structure of sputum bacteriaceae in patients with different stages of silicosis showed that different bacteriaceae had different predominance in patients with different stages of silicosis. The dominant bacteriaceae in patients with stage I silicosis were Streptococcaceae, Purvoisaceae and Moraxella; the dominant bacteriaceae in Stage II silicosis were Streptococcaceae, Bacillus bacteriaceae and Enterococcaceae; and streptococcaceae in Stage III silicosis. Therefore, it is speculated that Streptococcaceae may be the dominant bacteriaceae in silicosis patients. Compared with the control group, the dominant bacteriaceae and Streptococcaceae are the dominant bacteriaceae. Similarly, there was no difference in the proportion of silicosis patients in each stage of actinomycetes and Fusobacteriaceae.
After analyzing the sputum bacteria structure of patients with different stages of silicosis, it was found that different bacteria genera were dominant in patients with different stages of silicosis. Among them, the dominant bacteria genera in patients with stage I silicosis were Streptococcus, Pramella and Moraxella, and the content of Moraxella was much higher than that of patients with other stages of silicosis. Therefore, Moraxella may be the dominant bacteria genus in patients with Stage I silicosis. The dominant bacteria genera in the second stage of silicosis are Streptococcus, Enterococcus and Bacillus, while the dominant bacteria genera in the third stage of silicosis are Streptococcus, Prevotella and Enterococcus. In addition, there was no difference in the proportion of actinomycetes and Fusobacteriaceae in any stage silicosis patients.
Changes in phyla, class, order and family are often caused by changes in lower microflora, and targeted observation and treatment are necessary in clinical practice. Therefore, for stage I silicosis patients, the microflora that should be focused on include the increase of hemophilus, Neisseria, and Moraxella. For stage II silicosis patients, it is the decrease of Prevotella and Wechtella. For the third stage of silicosis patients, it is the increase of Neisseria and violomonas. In the study of clinical treatment, it is necessary to properly consider the influence of microbial flora structure change, in order to provide a basis for the prevention and treatment of silicosis.
In the analysis of sample diversity, the changes of microflora in each group were not clearly shown, especially in the analysis of POC, which may be due to the small sample size and poor consistency within and between silicosis groups. Therefore, further research should increase the number of samples to reduce the impact of differences between samples on the results.
To sum up, this study collected sputum samples from silicosis patients, extracted genomes and analyzed the structure of their respiratory tract microflora. It was found that the microflora of silicosis patients was different from that of the control group, as well as different stages of silicosis, suggesting that more and more extensive studies should be conducted to explore the relationship between the occurrence and development of silicosis and respiratory tract microflora. It is expected to provide new ideas for prevention and treatment of silicosis.
Conclusion
The sputum flora of silicosis patients is mainly firmicutes, Proteobacteria, Bacteroidetes, actinobacteria, clostridium, which is consistent with the main flora of healthy people. However, the dominant bacterial groups were different in silicosis patients of different stages. For stage I silicosis patients, we should pay more attention to the increase of hemophilus, Neisseria, and Moraxella. For stage II silicosis patients, it is the decrease of Prevotella and Wechtella. For the third stage of silicosis patients, it is the increase of Neisseria and violomonas. In the diversity analysis, through Alpha diversity analysis, the sample strains used for sequencing in this study were evenly distributed and of good quality. By LefSe analysis, the microflora of stage III silicosis patients had a great influence on the difference between groups. By PCA principal component analysis, the differences among all groups were not obvious, and the sample size should be further increased.
References
- Hilty M, Burke C, Pedro H, Cardenas P, Bush A, Bossley C, et al. Disordered microbial communities in asthmatic airways. PloS one. 2010; 5(1): e8578.
- Charlson ES, Bittinger K, Haas AR, Fitzgerald AS, Frank I, Yadav A. Topographical continuity of bacterial populations in the healthy human respiratory tract. American journal of respiratory and critical care medicine. 2011; 184(8): 957-963.
- Blainey PC, Milla CE, Cornfield DN, Quake, SR. Quantitative analysis of the human airway microbial ecology reveals a pervasive signature for cystic fibrosis. Science translational medicine. 2012; 4(153): 153ra130.
- Quinn RA, Phelan VV, Whiteson KL, Garg N, Bailey BA, Lim YW, et al. Microbial, host and xenobiotic diversity in the ; cystic fibrosis sputum metabolome. The ISME journal. 2016; 10(6): 1483–1498.
- Galiana A, Aguirre E, Rodriguez JC, Mira A, Santibañez M, Candela I, et al. Sputum microbiota in moderate versus severe patients with COPD. The European respiratory journal, 2014; 43(6): 1787-1790.
- Lee SW, Kuan CS, Wu LS, Weng JT. Metagenome and Metatranscriptome Profiling of Moderate and Severe COPD Sputum in Taiwanese Han Males. PloS one. 2016; 11(7): e0159066.
- Ege MJ, Mayer M, Normand AC, Genuneit J, Cookson WO, BraunFahrländer C, et al. Exposure to environmental microorganisms and childhood asthma. The New England journal of medicine. 2011; 364(8): 701-709.
- Molyneaux PL, Mallia P, Cox MJ, Footitt J, Willis-Owen SA, Homola D, et al. Outgrowth of the bacterial airway microbiome after rhinovirus exacerbation of chronic obstructive pulmonary disease. American journal of respiratory and critical care medicine. 2013; 188(10): 1224-1231.
- Rogers GB, van der Gast CJ, Cuthbertson L, Thomson SK, Bruce KD, Martin ML, et al. Clinical measures of disease in adult nonCF bronchiectasis correlate with airway microbiota composition. Thorax. 2013; 68(8): 731-737.
- Zhao J, Murray S, Lipuma JJ. Modeling the impact of antibiotic exposure on human microbiota. Scientific reports. 2014; 4: 4345.
- Rogers GB, Zain NM, Bruce KD, Burr LD, Chen AC, Rivett DW, et al. A novel microbiota stratification system predicts future exacerbations in bronchiectasis. Annals of the American Thoracic Society. 2014; 11(4): 496-503.
- Charlson ES, Bittinger K, Haas AR, Fitzgerald AS, Frank I, et al. Topographical continuity of bacterial populations in the healthy human respiratory tract. American journal of respiratory and critical care medicine. 2011; 184(8): 957-963.
- Hilty M, Burke C, Pedro H, Cardenas P, Bush A, Bossley C, et al. Disordered microbial communities in asthmatic airways. PloS one. 2010; 5(1): e8578.
- Van der Gast CJ, Walker AW, Stressmann FA, Rogers GB, Scott P, Daniels TW, et al. Partitioning core and satellite taxa from within cystic fibrosis lung bacterial communities. The ISME journal. 2011; 5(5): 780-791.
- Erb-Downward JR, Thompson DL, Han MK, Freeman CM, McCloskey L, Schmidt LA, et al. Analysis of the lung microbiome in the “healthy” smoker and in COPD. PloS one. 2011; 6(2): e16384.
- Cox MJ, Allgaier M, Taylor B, Baek MS, Huang YJ, Daly RA, et al. Airway microbiota and pathogen abundance in age-stratified cystic fibrosis patients. PloS one. 2010; 5(6): e11044.
- Blainey PC, Milla CE, Cornfield DN, Quake SR. Quantitative analysis of the human airway microbial ecology reveals a pervasive signature for cystic fibrosis. Science translational medicine. 2010; 4(153): 153ra130.
- Munck C, Helby J, Westergaard CG, Porsbjerg C, Backer V, Hansen LH. Smoking Cessation and the Microbiome in Induced Sputum Samples from Cigarette Smoking Asthma Patients. PloS one. 2016; 11(7): e0158622.
- Morris A, Beck JM, Schloss PD, Campbell TB, Crothers K, Curtis JL, et al. Comparison of the respiratory microbiome in healthy nonsmokers and smokers. American journal of respiratory and critical care medicine. 2013; 187(10): 1067-1075.
- Daniels TW, Rogers GB, Stressmann FA, van der Gast CJ, Bruce KD, Jones GR, et al. Impact of antibiotic treatment for pulmonary exacerbations on bacterial diversity in cystic fibrosis. Journal of cystic fibrosis : official journal of the European Cystic Fibrosis Society. 2013; 12(1): 22-28.
- Stokell JR, Gharaibeh RZ, Hamp TJ, Zapata MJ, Fodor AA, Steck TR. Analysis of changes in diversity and abundance of the microbial community in a cystic fibrosis patient over a multiyear period. Journal of clinical microbiology. 2015; 53(1): 237-247.
- Lim MY, Yoon HS, Rho M, Sung J, Song YM, Lee K, Ko G. Analysis of the association between host genetics, smoking, and sputum microbiota in healthy humans. Scientific reports. 2016; 6: 23745.
- Jelsbak L, Johansen HK, Frost AL, Thøgersen R, Thomsen LE, Ciofu O, et al. Molecular epidemiology and dynamics of Pseudomonas aeruginosa populations in lungs of cystic fibrosis patients. Infection and immunity. 2007; 75(5): 2214-2224.
- Sener B, Köseoğlu O, Ozçelik U, Kocagöz T, Günalp A. Epidemiology of chronic Pseudomonas aeruginosa infections in cystic fibrosis. International journal of medical microbiology: IJMM. 2001; 291(5): 387-393.
- Tunney MM, Klem ER, Fodor AA, Gilpin DF, Moriarty TF, McGrath SJ, et al. Use of culture and molecular analysis to determine the effect of antibiotic treatment on microbial community diversity and abundance during exacerbation in patients with cystic fibrosis. Thorax. 2011; 66(7): 579-584.
- Vasileiadis S, Puglisi E, Arena M, Cappa F, Cocconcelli PS, Trevisan M. Soil bacterial diversity screening using single 16S rRNA gene V regions coupled with multi-million read generating sequencing technologies. PloS one. 2012; 7(8): e42671.
- Caporaso JG, Bittinger K, Bushman FD, DeSantis TZ, Andersen GL, Knight R. PyNAST: a flexible tool for aligning sequences to a template alignment. Bioinformatics (Oxford, England). 2010; 26(2): 266-267.
- Quaglio AEV, Grillo TG, De Oliveira ECS, Di Stasi LC, Sassaki LY. Gut microbiota, inflammatory bowel disease and colorectal cancer. World journal of gastroenterology. 2022; 28(30): 4053–4060.
- Adler CJ, Dobney K, Weyrich LS, Kaidonis J, Walker AW, Haak W, Bradshaw CJ, Townsend G, Sołtysiak A, Alt KW, Parkhill J, Cooper, A. Sequencing ancient calcified dental plaque shows changes in oral microbiota with dietary shifts of the Neolithic and Industrial revolutions. Nature genetics. 2013; 45(4): 450–455e1.