
SciBase Journals
SciBase Oncology
ISSN 2691-7785
- Article Type: Research Article
- Volume 1, Issue 1
- Received: Aug 11, 2023
- Accepted: Sep 07, 2023
- Published Online: Sep 14, 2023
Association of CCNG1 and FDXR Gene Expression during Radiotherapy with Disease - And Therapy-Related Confounding Factors in Breast Cancer Patients
Eftimov Aleksandar1*; Trencheva Katerina2; Petlichkovski Aleksandar3; Jakјovski Zlatko4; Vasev Nikola5; Peshevska Meri5; Ismaili Ilir5; Lukarski Dushko5,6; Topuzovska Sonja7
1Institute of Pathology, Faculty of Medicine, Ss. Cyril and Methodius University, Skopje, R. North Macedonia.
2Institute of Public Health of the Republic of North Macedonia, Skopje, R. North Macedonia.
3Institute of Immunobiology and Human Genetics, Faculty of Medicine, Ss. Cyril and Methodius University in Skopje, R. North Macedonia.
4Institute of Forensic Medicine, Faculty of Medicine, Ss. Cyril and Methodius University in Skopje, R. North Macedonia.
5University Clinic of Radiotherapy and Oncology, University Clinic Center Mother Teresa, Skopje, R. North Macedonia.
6Faculty of Medicine, Ss. Cyril and Methodius University, Skopje, R. North Macedonia.
7Institute of Medical and Experimental Biochemistry, Faculty of Medicine, Ss. Cyril and Methodius University, Skopje, R. North Macedonia.
*Corresponding Author: Eftimov Aleksandar
Institute of Pathology, Faculty of Medicine, Ss. Cyril and Methodius University, Skopje, R. North Macedonia.
Tel: +389-70-77-93-96;
Email: aleks.eftimov@yahoo.com
Abstract
Purpose: The objective of this study is to investigate the changes in CCNG1 and FDXR gene expression during RT in breast cancer patients and associate the observed changes with disease- and therapy-related confounding factors through a nonrandomized, controlled, open-trial clinical study of 57 breast cancer patients.
Materials and methods: Expression of CCNG1 and FDXR were analyzed using quantitative Reverse Transcription Polymerase Chain Reaction (qRT-PCR) in leukocytes of peripheral blood samples.
Results: Our findings indicate significant up-regulation of FDXR up to 48h after first RT fraction, with no significant expression alterations of CCNG1 at 24h and 48h. Fold changes of CCNG1 were slightly lower (1.13-1.23) than for FDXR (1.49-2.08). RTinduced FDXR and CCNG1 expression alterations could not be significantly associated with Mean Blood Dose (MBD, estimated dose to the blood per fraction), patient age, Total Irradiated Volume (TIV), surgery type, recidive, prior exposure to chemotherapy, target therapy with Herceptin®, hormone therapy started before RT, presence of HER2-positive neoplasm. At 24h post RT, FDXR fold changes were significantly higher in hormone-sensitive neoplasm (1.79±0.9) than in patients without (1.37±0.5). On opposite, FDXR fold changes 48h to 24h post RT were significantly higher in patients without p53-positive neoplasm (2.14±1.4) than in patients with p53-positive neoplasm (1.57±1.6).
Results: A total of 104 ICU patients with COVID-19 were included. The majority, 73.1% were male; the median age was 60 (IQR; 45-70) years, with 36.5% patients having at least one chronic medical condition. Out of 165, 104(63%) patients needed mechanical ventilation. Invasive and noninvasive ventilation were used in 93(89.4%) and 11(10.6%) patients, respectively. The most common treatments used by the patients were steroid (100%), antibiotics (99%) and vaso-pressors (57.7%). Experimental antiviral therapy was used in only 1% (n=1) of patients. Overall the ICU mortality was 14.6% and 88.5% among mechanically ventilated patients. Being fatigue (AOR=7.599; 95% CI: 1.65-35.12), IMV (AOR=5.28; 95% CI: 1.01-27.71), and septic shock (AOR=12.83; 95% CI: 1.46-13.11) were a significant risk factors for the ICU outcomes of the patients.
Conclusion: The findings of this study have important implications in understanding the effects of gene expression alteration due to RT and its implication and association with other disease- and therapy-related confounding factors.
Keywords: Radiotherapy; Confounding factors; Breast cancer; FDXR; CCNG1; Gene expression.
Abbreviations: ATM: Ataxia Telangiectasia Mutated; BRCA1: Breast Cancer-Associated Protein 1; CCNG1: Cyclin G1; CT: Computerized Tomography; DC: Dicentric Chromosomal; DDR: DNA-Damage Response; ER: Estrogen Receptor; FDXR: Ferredoxin Reductase; HER2: Human Epidermal Growth Factor Type 2 Receptor; HPRT1: Hypoxanthine Phosphoribosyl Transferase 1; IARC: International Agency For Research On Cancer; IRP2: Iron Regulatory Protein 2; MED: Mean Blood Dose; mtDNA: mitochondrial DNA; PR: Progesterone Receptor; qRT-PCR: quantitative Reverse Transcription Polymerase Chain Reaction; RT: Radiotherapy; TBI: Total Body Irradiated; TIV: Total Irradiated Volume; WRBT: Whole-Breast RT.
Citation: Aleksandar E, Katerina T, Aleksandar P, Zlatko J, Nikola V, et al. Association of CCNG1 and FDXR Gene Expression during Radiotherapy with Disease- And Therapy-Related Confounding Factors in Breast Cancer Patients. SciBase Oncol. 2023; 1(1): 1001
Introduction
According to the WHO’s International Agency for Research on Cancer (IARC) GLOBOCAN cancer statistics for 2020, breast cancer is the most commonly diagnosed cancer in women worldwide, with 2.26 million cases in 2020 (11.7%) and is the fifth cause of cancer death with 685,00 deaths (6.9%), after lung, colorectal, liver and stomach cancers. Among women, breast cancer accounts for 1 in 4 cancer cases and for 1 in 6 cancer deaths, ranking first for incidence in 159 countries, and for mortality in 110 of 185 countries [1]. In men, breast cancer is relatively rare, accounting for <1% of all diagnosed cancers. In North Macedonia in 2020, there were 988 new cases of breast cancer (59.8 persons per 100,000) and 316 (16.7 per 100,000) breast cancer-caused deaths [2].
Common treatment of breast cancer includes combination of surgery, RT with X-rays, chemotherapy and hormone therapy, depending on the menopausal status of patient, histological cancer type, disease stage, primary tumor grade, Estrogen Receptor (ER) and Progesterone Receptor (PR) status and Human Epidermal Growth Factor Type 2 Receptor (HER2) overexpression and/or amplification. According to the ESMO Clinical Practice Guidelines, Whole-Breast RT (WBRT) is strongly recommended after breast-conserving surgery [I,A] [3], as it reduces the 10-year risk of any first recurrence by 15% and the 15-year risk of breast cancer-related mortality by 4%. Additionally, WBRT reduces the 10-year risk of any recurrence by 10% and the 20-year risk of breast cancer-related mortality by 8% In node-positive patients post-mastectomy [4]. RT doses for local and/or regional adjuvant irradiation are 45-50 Gy divided in 25-28 fractions of 1.8-2.0 Gy, with a typical boost dose of 10-16 Gy in 2 Gy single doses [3]. Shorter fractionation schemes (e.g. 15-16 fractions with 2.5-2.67 Gy single dose) have shown similar effectiveness and comparable side effects as well and are frequently [5].
RT is recommended as adjuvant therapy in order to eradicate residual disease and thus reduce local reoccurrence. RT causes cancer cell death mainly by Ionizing Radiation (IR)-induced DNA double strand breaks, which trigger cascade of cellular events termed DNA-Damage Response (DDR), including damage sensing, signal transduction to the effectors of DNA repair, cell cycle arrest and apoptosis induction. Induction of genes involved in DDR involves the recognition of DNA damage by kinases Ataxia Telangiectasia Mutated (ATM) and ataxia telangiectasia, which leads to Activation of p53 and Rad3-Related (ATR), which phosphorylate and activate transcription factors responsible for inducing mRNA expression. Main DDR-regulated transcription factors include p53, Nuclear Factor kappa B (NF-kappa B), Breast Cancer-Associated Protein 1 (BRCA1) and AP-1 [6]. Moreover, exposure to IR causes alterations in gene expression. Response to IR-induced DNA damage is subject of intra-individual variations, possibly related to mutations of key DDR pathway genes or to the individual capacity to modulate the expression of DDR genes after IR exposure [7]. Such can be influenced by age, smoking, diabetes, collagen vascular disease and genotype.
Nowadays, follow-up of the progress of RT and prediction of outcome early in a treatment regimen is performed by following the level changes of various molecular biomarkers. Versatile established and emerging biodosimetry approaches are used for this purpose. Last decades’ research in the field was mostly based on determination based on cytogenetic-based end points using Dicentric Chromosomal (DC) aberration assays and microarray hybridization assays, electron spin resonance, proteinand metabolomic-based methods [8]. Apart from gene expression biomarkers, novel approaches also include extra-nuclear mitochondrial DNA (mtDNA), susceptible to damage due to the lack of histone protection and chromatin structure [9].
The possibility to use the relative expression levels of genes which respond to radiation in peripheral blood lymphocytes for estimation of radiation exposures was introduced many years ago, and nowadays is widely employed as superior, time- and cost-effective approach in biodosimetry, able to predict absorbed radiation dose within hours to days after exposure [8,10,11]. The ideal radiation biomarker is searched, that should provide information of dose and time and should be independent of environmental and confounding factors such as age, smoking, therapy etc. As ideal radiation biomarker does not exist, estimation of radiation exposure by identifying and quantifying a group of genes is performed, that are usually up-regulated under IR, that represent the “gene signatures” or “metagenes” of IR [8,12,13]. IR signatures are mainly consisted of genes regulated by p53 (e.g. PCNA, GADD45, RPS27L, MDM2, SESN1, FDXR, and DDB2) and are involved in DNA damage repair, apoptosis and cell cycle regulation [14]. FDXR, DDB2 and CCNG1 together could be used to determine low doses and could be used to study the influence of versatile cofounding factors. Meanwhile, PHPT1, FDXR and DDB2 are more specific to high doses estimation with linear fit, good sensitivity and reproducibility [11,15]. Other IR-responsive genes include CDKN1A, DDB2, CCNG1 and GADD45A. Total Body Irradiated (TBI) patients had up-regulated BBC3, FDXR, CDKN1A, PCNA, XPC, GADD45A, DDB2 and POLH, with expression decreased in time-dependent manner, being consistently higher 6h after irradiation than after 24h for all dose tested [16]. FDXR, AEN, DDB, PHLDA3, GADD45A, ZMAT3 and PCNA were up-regulated and MYC, PFKP and PTGDS were down-regulated after ex vivo human whole blood irradiation with three different doses (0.56 Gy, 2.23 Gy and 4.45 Gy) [13].
The last two decades’ cancer research brought great understanding of the transcriptional response in cells to IR exposure, revealing complex alterations in expression of specific genes depending on radiation dose, dose-rate, radiation quality and lapse between stress and analysis [14]. However, the influence of other confounding factors including age, blood parameters, ionizing radiation dose, previous chemotherapy administration, previous surgery etc. remain largely unknown, except of few studies [17,18]. The knowledge regarding their involvement in gene expression level changes of well-established breast cancer biomarkers would reveal valuable insights into gene expression alterations that might not be result of IR. The findings would provide implementation of group- or patient-specific RT approaches, resulting in less side effects and better therapy outcomes.
From all “metagenes” of IR, the Ferredoxin Reductase (FDXR) gene is the best stand-alone biomarker of IR exposure for assessing universal response to DNA damage. Gene for FDXR encodes FDXR, a mitochondrial flavoprotein performing transport of electrons from NADPH for Cytochrome P450 (CYP-450) enzymes, sensitizing cells to oxidative stress-induced apoptosis and regulating several iron homeostasis-regulating components, among which Iron Regulatory Protein 2 (IPR2) that negatively regulates p53 expression [19]. Expression of FDXR is regulated by p53, with relatively low level of endogenous expression and variability among individuals but high sensitivity to radiation exposure [10] and very high levels of fold changes in peripheral blood [15]. FDXR has linear, dose-dependent transcriptional ex vivo and in vivo up-regulation [7,10,14,15,17]. Statistically significant changes from 0.15 Gy to 3.5 Gy were found in FDXR expression, along with good linear correlation [17]. FDXR is the most accurate gene for providing dose estimates, when compared to BBC3, GDF15, TNFSF4, BAX, GADD45A, CDKN1A and DOB2 [10].
The Cyclin G1 (CCNG1) is another well-established biomarker of IR exposure. CCNG1 encodes a mitochondrial protein cyclin G1 that is associated with G2/M phase arrest in response to DNA damage, and also plays a role in promotion of cell growth following damage recovery. It is one of the target genes of p53, through which p53 mediates its role as an inhibitor of cellular proliferation, apoptosis, DNA repair, cell differentiation and angiogenesis [20]. It is one of the first genes shown to be overexpressed in breast cancer tissues and cell lines and also one of the downstream genes of the transcription factors activated through DDR identified as gene responsive to IR in whole human blood and in peripheral blood lymphocytes irradiated ex vivo [14,15,18]. Ex vivo CCNG1 analysis of IR responsiveness has shown low interindividual variability and linear dose response at low doses (25-100 mGy) [15]. It is also potent biomarker of IR exposure in vivo [9].
In our study, the changes in gene expression levels of the two target genes, FDXR and CCNG1 and the control gene HPRT1 were investigated in peripheral blood samples of 57 breast cancer patients exposed to high doses (2 Gy/fraction) of X-rays during external RT at three time points during first RT fraction, that are before RT (time 0), 24h and 48h after first RT fraction in order to validate them for biodosimetry purposes. To examine the cumulative effect of RT, quantified changes in FDXR and CCNG1 expression were compared between second and first RT fraction, between third and second RT fraction and between third and first RT fraction. Finally, changes in gene expression were associated with 11 disease- and therapy-related confounding factors affecting FDXR and CCNG1 response to IR; including:
1) age;
2) MED;
3) TIV;
4) surgery type;
5) status of recidive;
6) (not)/administered chemotherapy;
7) presence of hormone-sensitive neoplasm;
8) presence of HER2-positive neoplasm;
9) presence of p53-positive neoplasm;
10) administration of target therapy Herceptin®
(s.c.600
mg) and
11) hormone therapy started before RT
Materials and methods
Patients, blood sampling and irradiation
In this non-randomized, controlled open-trial clinical study, 57 patients were included (Table 1) (56 female and 1 male), aged 55.3 ± 9.8 diagnosed with breast cancer and referred to elective RT at the University Clinic for Radiotherapy and Oncology in Skopje. 52 (91.22%) of the patients were diagnosed with HER2- positive neoplasm, 45 (78.95%) with p53-positive neoplasm and 53 (92.98%) with hormone-positive neoplasm. 40 patients (71.43%) were previously subjected to radical mastectomy with partial or complete dissection of axillary lymph nodes (type 1), 11 (19.64%) to quadrantectomy (type 2), while for the other 5 (8.93%) excision of the breast tumor was performed (type 3). Between surgery and RT, 26 patients were treated with cyclophosphamide/doxorubicin hydrochloride/paclitaxel according to AP protocol, 18 patients with cyclophosphamide/epirubicine hydrochloride/paclitaxel according to EP protocol and 1 patient with cyclophosphamide/epirubicine hydrochloride/docetaxel according to ED protocol. Additionally, 53 patients were treated with Herceptin® (s.c. 600 mg), and 51 patients were under hormone therapy.
The hospital was designated officially starting from June 8, 2020 G.C. as the national center for the management of COVID-19-infected patients in Ethiopia mainly serving the city and surrounding areas populations. It was re-purposed to have different compartments on already existing building, including an Intensive Care Unit (ICU), Semi-ICU, HDU and also male and female wards for treatment of patients at different level of illnesses which is assigned according to WHO criteria. The adult ICU has 13 beds with MV and dialysis machine. RT-PCR SARS-CoV-2– positive cases were admitted to the hospital. The initial decision to admit all patients to treatment center was because of the inconvenience of home isolation and management in many Ethiopian settings. Severe and critical cases were admitted to the ICU and Semi-ICU, whereas the others remained in the general ward and HDU. The care of COVID-19 patients is given by a multidisciplinary team composed of nurses, residents, laboratory technologists, pharmacists, internists, anesthesiologists, pulmonologist, emergency and critical care specialist and other supporting staff. The management of COVID-19 in the center is in line with the national and St. Paul’s treatment guideline.
Patients aged under 25 years were excluded from the study; those who were exposed to IR in the last 10 days prior to the beginning of RT during a diagnostic procedure, if they received concomitant RT or chemotherapy and/or were with severe comorbidities.
The informed consent was obtained from each individual and the Ethics Committee for research with people at the Faculty of Medicine, Ss Cyril and Methodius University, Skopje, R. North Macedonia, approved investigation with human subjects according to The Code of Ethics of the World Medical Association-Declaration of Helsinki.
All of the patients were referred to a routine laboratory check-up, without previous RT. During a regular laboratory routine control, 2-3 mL of peripheral blood was taken and filled in EDTA-coated vacutainer, according to Abend et al. [10] , at three time points: 1) before beginning of RT; 2) 24 h after the first, and before the second fraction of RT and 3) 48 h after the first, and before the third fraction of RT. At each time point, CRP and WBC count was measured for all patients from the IG.
The adjuvant radiation treatment of all patients was carried out on linear accelerator Varian Clinac 23EX (Varian, Palo Alto, CA, USA) with combination of two photon energies (6 MV and 15 MV), which is at the disposal at the University Clinic for Radiotherapy and Oncology in Skopje. The prescribed total tumor dose for every patient was 50 Gy, divided in 25 fractions (5 weeks x 5 doses). The daily dose of 2 Gy was applied at every 24h with dose-rate of 400 MU/min. The elective RT after the performed Computerized Tomography (CT) simulation was conducted with 2 tangential and 1 supra/infraclavicular field of frontal thoracic wall and of regional lymphatic pool with 46 patients and with 2 tangential fields of frontal thoracic wall with 11 patients without supra/infraclavicular radiation.
Total RNA Analysis
Because of the small number of cases in ICU all consecutive ICU admitted patients with RT-PCR confirmed COVID-19 and received mechanical ventilation support from June 8 to October 11, 2020 G.C were included in the study.
Subjects
Total RNA analysis was performed as in [24].
Processing of biological material for obtaining a sample (lysate of total leukocytes) for RNA isolation
From the obtained 2-3 mL of EDTA-blood samples, a sample (lysate of total leukocytes) for RNA isolation was obtained by selective erythrocyte osmotic lysis with ex tempore prepared solution of NH4 Cl and NH4 HCO3 in deionized water. 300 μL EDTAblood and 1 mL of this solution was mixed for 10 min at room temperature following a 10-minute centrifugation and discarding of lysed erythrocytes. The remaining liquid mass from total leukocytes was immediately dissolved in 300 μL RLT solution, which contained guanidine thiocyanate. Thus, lysate from total leukocytes was obtained, in which the present endogenous and, possibly exogenous ribonucleases, were inactivated from the strong chaotropic agent guanidine thiocyanate.
Automated isolation of total RNA from lysate of total leukocytes
The isolation procedure of total RNA was made through entirely automated process of Biorobot EZ1 and appropriate EZ1 RNA Tissue Mini Kits (Qiagen, Hilden, Germany) at the Institute for Immunobiology and Human Genetics at the Faculty of Medicine in Skopje. Separation of the total RNA from the remaining cell components of this device are based on the application of magnetic particles in presence of chaotropic salt. The obtained isolate, as well as the lysate from leukocytes, were kept at -80°C until the next step - determination of expression of radioresponsive genes with qRT - PCR method.
Gene expression analysis with qRT-PCR (quantitative reverse transcription polymerase chain reaction)
The level of expression of the radio-responsive genes in peripheral blood from patients ionizied with RT was determined by ΔΔCt method, in the Laboratory for molecular pathology, Institute of Pathology, Faculty of Medicine in Skopje. Reverse transcription was performed using High Capacity cDNA Archive Kit (Applied Biosystems, Foster City, CA, USA). The temperature conditions for the process of reverse transcription were 25°C for 10min, then 37°C for 120min and 85°C for 5min.
After cDNAs were synthesized, qPCR on 7500 Real-Time PCR System (Applied Biosystems, Foster City, CA, USA) was performed with TaqMan Universal PCR Master Mix Applied Biosystems, Foster City, CA, USA) and primers used according to а study of Kabacik et al. [14] (Supplementary material, Table S1). The temperature conditions for the PCR were the following: 10 min initial denaturation at 95°C, followed by 40 cycles of 15s denaturation at 95°C and 1 min annealing at 60°C. The following parameters were determined:
(12) ΔΔCt (FDXR-HPRT1) and ΔΔCt (CCNG1-HPRT1), i.e.,
normalized expression of the target gene (FDXR, CCNG1) in relation to the endogen control, HPRT1;
(13) 2 -ΔΔCt (FDXR-HPRT1) - fold change of the level of expression of the target gene FDXR in relation to HPRT1 and
(14) 2 -ΔΔCt (CCNG1-HPRT1) - fold change of the level of expression of the target gene CCNG1 in relation to HPRT1.
Statistical analysis
The statistical analysis was performed in SPSS Statistics software 23.0 (IBM Corporation, Armonk, N.Y., USA). KolmogorovSmirnov test was used for testing of normality and distribution of data. For comparison of the analyzed variables at the three time points parametric and non-parametric tests for dependent samples (paired t-test, repeated-measures ANOVA, Friedman ANOVA, Wilcoxon Matched pairs, Cochran Q test, Fischer’s Exact test, Pearson Chi-square test) were used. Pearson product moment correlation and Spearman rank-order correlation were used to investigate the correlation of the fold change of the level of expression of FDXR and CCNG1 to HPRT1 and each of the investigated disease- and treatment-related parameters. The statistical significance for all tests was defined at the level of p˂0.05.
Results
Gene expression profile of HPRT1, FDXR and CCNG1 during RT
Average expression of HPRT1 and CCNG1 at the three time points reveled comparable results, with FDXR being slightly higher at all time points (Figure 1, Supplementary Material, Table S2). Comparison of average Ct HPRT1, Ct FDXR and Ct CCNG1 using Friedman ANOVA (Supplementary material, Table S3) confirmed no statistically significant differences in expression of the control gene, HPRT1, as expected (p=0.581) and of CCNG1 (p=0.114). Post-hoc comparison in pairs shows no significant differences for HPRT1, but significantly lower values for Ct CCNG1 at 2nd time point in relation to 1st (p=0.009) and at 3rd time point in relation to 1st (p=0.028). Finally, a statistically significant difference in the threshold cycle for FDXR was observed (p<0.0001) in the analyzed period. Significant differences are confirmed among all compared time points.
The average values of the normalized expressions of CCNG1 and FDXR in relation to the control gene HPRT1 were (1) 0.19±0.6, (2) 0.29±0.6 and (3) 0.38±0.7 and (1) 2.48±0.8, (2) 2.07±0.97 and (3) 1.67±0.96, respectively (Supplementary material, Table S4). The observed slight increases of CCNG1 expression were not statistically significant (p=0.166). FDXR expression decreases. Min-max ranges were comparable for normalized CCNG1 between all-time points, which was not the case with normalized FDXR, where much wider ranges were observed.
The average ∆Ct (FDXR-HPRT1) values were significantly different between the defined time points (F=30.3, p<0.0001) (Table 2). Post-hoc comparison in pairs, using the Bonferroni correction confirmed significantly higher average value of ΔCt (FDXR-HPRT1) before RT and 24h and 48h after first RT fraction (p=0.01 and p<0.0001) and between 24h and 48h after first RT fraction (p<0.0001).
The fold change of the level of expression of CCNG1 and FDXR to HPRT1 had comparable mean ± SD values for the three variables (24h after first RT fraction, 48h after first RT fraction and difference between 48h and 24h post first RT fraction) for both genes, except of 2 -∆∆Ct, B (FDXR - HPRT1), with higher mean and SD values (2.08±1.7) (Table 3).
Comparison of changes in gene expression levels of FDXR and CCNG1 among the defined time points (24h after vs. time 0, 48h vs. 24h and 48h vs. time 0) using Cochran Q test revealed that for CCNG1, in all three cases, increase in CCNG1 expression levels was registered for ≥61% of the patients, while only one third (≥33%) of the patients exhibited decreased CCNG1 expression when each time point was compared to the previous one, but without statistical significance (p<0.8187). Similar, but more intense and statistically significant trend (p<0.0429) was observed for FDXR, where for each compared pair, only 17.54% and 12.28% of the patients exhibited decrease in FDXR expression 24h and 48h after first radiation when compared to preirradiation expression, respectively (Table 4). The increase was less observable when comparing FDXR expression 48h and 24h after first radiation, when 28.07% of the patients had decreased FDXR expression, and for 71.93% of the patients, FDXR levels increased 48h after first radiation compared to 24h.
Association of gene expression changes with MBD (estimated dose to the blood per fraction
Associations of the fold change of the level of expression of CCNG1 and FDXR in relation to HPRT1 to MBD (mGy) generated using Pearson product moment correlation and Spearman rankorder correlation (Supplementary material, Table S5) revealed statistically significant correlation only between 2 -∆∆Ct, A (CCNG1 - HPRT1) and MBD (p=0.027) and 2-∆∆Ct (BvsA) (CCNG1-HPRT1) and MBD (p=0.0048) (Figure 2). Here, fold change of Ct (CCNG1- HPRT1) 24h after first RT fraction is negatively related to MBD (R = -0.295), while fold change of Ct (CCNG1-HPRT1) 48h to 24h after first RT fraction is positively linearly related to MBD (R = 0.372).
Using paired t-test, the expression level changes of CCNG1 and FDXR between time points were compared to MBD (mean ± SD, mGy) (Supplementary material, Table S6). For CCNG1, largest, and statistically significant difference was observed between 48h and 24h after RT (t=3.44, p=0.0011), where the mean estimated dose to the blood per fraction for patients with decreased CCNG1 expression levels 48h compared to 24h after first RT fraction was 48.28±12.9 mGy, and for the patients with increased CCNG1 expression was 58.18±8.6 mGy. For FDXR, statistical significance could not be achieved at any of the three time point comparisons.
Association of gene expression changes with disease-related confounding factors
Association of gene expression changes with patient age
Associations of the fold change of the level of expression of CCNG1 and FDXR in relation to HPRT1 to patient age generated using Pearson product moment correlation and Spearman rank-order correlation (Supplementary material, Table S7) did not reveal any statistically significant correlation. Therefore, it can be concluded that the CCNG1 and FDXR expression changes 24h, 48h and from 48h to 24h after first RT fraction are not associated with patient age. This conclusion is also supported by evidence of no statistically significant difference between gene expression changes at the compared time points and the mean patient age (Supplementary material, Table S8), except for CCNG1 expression change 48h compared to 24h after first RT fraction, for which statistically significant difference was observed in changes at different mean patient age (51.95±10.03 versus 57.25±9.30) (p=0.048).
Association of gene expression changes with TIV
Association of the fold change of expression level of CCNG1 and FDXR in relation to HPRT1 to TIV (m3 ) generated using Pearson product moment correlation and Spearman rank-order correlation (Supplementary material, Table S9) revealed only correlations of no statistical significance. Search of statistical significance between expression changes of CCNG1 and FDXR between 2nd and 1st, 3rd and 1st and 3rd and 2nd time points with mean ± SD TIV values using paired t-test (Supplementary material, Table S10), did not reveal such. Therefore, it can be concluded that CCNG1 and FDXR expression changes during RT cannot be associated with patients’ TIV.
Association of gene expression changes with surgery type
Association of the fold of expression changes of CCNG1 and FDXR 24h after first RT fraction, 48h after first RT fraction and between 48h and 24h after first RT fraction and the three different surgery types performed using Kruskal-Wallis ANOVA for non-normally distributed data and analysis of variance for normally distributed data (Supplementary material, Table S11) revealed no statistically significant differences between medians of 2-ΔΔCt for CCNG1 and FDXR at A, B or B vs A with any of the surgery types performed. The finding is supported by the lack of statistical significance between gene expression changes, i.e. decrease or increase between the three time points (24h after/ before first RT fraction, 48h after/before first RT fraction and 48h/24h after first RT fraction) and the surgery type (Supplementary material, Table S12). Therefore, no expression changes of CCNG1 and FDXR during RT could be associated with the type of surgery performed before RT.
Association of gene expression change with status of recidive
Association of gene expression change with status of recidive was examined in 55 patients. Pearson Chi-squared test evaluation of the significance of differences of the FDXR and CCNG1 expression changes between 24h after/before first RT fraction, 48h after/24 after first RT fraction and 48h after/before first RT fraction with status of recidive (Supplementary material, Table S13) revealed no significant differences between the gene expression changes, except for the changes of FDXR expression 24h after first RT when compared to gene expression before RT. Here, significant differences (p=0.032) were observed among patients that had and did not have cancer recidive. Decreased FDXR expression change 24h after first RT fraction was observed for 3 patients with and 7 patients without recidive; while increase in FDXR expression 24h after first RT fraction for 3 patients with and 42 patients without recidive
Association of gene expression change with prior exposure to chemotherapy
Examination of association between fold changes of FDXR and CCNG1 expression levels with administration of chemotherapy before RT using Mann-Whitney test and paired t-tests (Supplementary material, Table S14) revealed lack of statistically significant association between the two variables. The finding was further supported by lack of significance between FDXR and CCNG1 changes between time points (24h after/before first RT fraction, 48h after/24h after first RT fraction and 48h after/ before first RT fraction) and presence/absence of previous chemotherapy administration (Supplementary material, Table S15).
Association of gene expression changes with hormone-sensitive neoplasm
According to the results from the Mann-Whitney and paired t-tests (Supplementary material, Table S16), there is a statistically significant difference between median fold change of FDXR 24h after first RT fraction between patients that have (n=42) and do not have (n=11) hormone-sensitive neoplasm. Mean fold changes of CCNG1 for patients with hormone-sensitive neoplasm was 1.37±0.5, while for patients without was 1.79 ± 0.9. Despite this, no significant association could be observed between the gene expression change when comparing measured expression 24 after first RT fraction/before RT, 48h after first RT fraction/before RT and 48h after/24h after first RT fraction, for both FDXR and CCNG1 (Supplementary material, Table S17).
Association of gene expression change with hormone therapy started before RT
No significant difference of fold changes of FDXR and CCNG1 expression 24h after first RT fraction, 48h after first RT fraction and 48h/24h after first RT fraction with the (lack of) onset of hormone therapy before RT (Supplementary material, Table S18). The finding is further supported by lack of significant association between the changed gene expression between time points for both FDXR and CCNG1 (Supplementary material, Table S19) (p>0.05). Therefore, it can be concluded that onset of hormone therapy does not influence the fold changes in gene expression of FDXR and CCNG1 during RT.
Association of gene expression changes with HER2-positive neoplasm
In the case of HER2-positive neoplasm, Mann-Whitney and paired t-tests (Supplementary material, Table S20), revealed no statistically significant association with the fold change of FDXR and CCNG1 expression 24h after first RT fraction, 48h after first RT fraction and the difference between 48h and 24h after first RT fraction. The finding was supported by the lack of significant association between the changed gene expression of FDXR and CCNG1 between the compared time points and the presence/ absence of HER2-positive neoplasm (Supplementary material, Table S21). Therefore, presence/absence of HER2-positive neoplasm cannot be significantly associated with the observed FDXR and CCNG1 expression changes during RT.
Association of gene expression changes with target therapy Herceptin® (s.c.600 mg)
Fold changes of FDXR and CCNG1 at 24h after, 48h after and between 48h and 24h after first RT fraction were not significantly different among patients with administration of HER2- positive breast cancer target therapy Herceptin® (trastuzumab, 600 mg) when compared with patients that were not treated with Herceptin® (Supplementary material, Table S22, p>0.05). However, Pearson Chi-squared test results (Supplementary material, Table S23) revealed statistically significant association (p=0.043) between the CCNG1 expression change between 48h after and before first RT fraction and Herceptin® administration. CCNG1 expression was decreased for 7 patients (58.33%) treated with Herceptin® and 11 patients (26.83%) not treated with Herceptin® , while CCNG1 expression was increased for 5 patients (41.67%) on Herceptin® treatment and 30 patients (73.17%) that were not on Herceptin® treatment.
Association of gene expression changes with p53-positive neoplasm
Correlation of the fold changes of FDXR and CCNG1 expression at 24h, 48h and the difference between 48h and 24h after first RT fraction with presence of p53-positive neoplasm (Supplementary material, Table S24) revealed statistically significant difference of fold changes of FDXR comparing gene expression at 48h to gene expression at 24h after first RT fraction among patients with and without p53-positive neoplasm (p=0.0079). The mean 2-ΔΔCt, (BvsA) of FDXR in patients with p53-positive neoplasm (n=36) (1.57±1.6) was significantly lower compared to the mean 2-ΔΔCt,(BvsA) in patients without p53-positive neoplasm (2.14±1.4). However, no statistically significant association between FDXR and CCNG1 expression change between time points and the presence of p53 positive neoplasm was found (Supplementary material, Table S25).
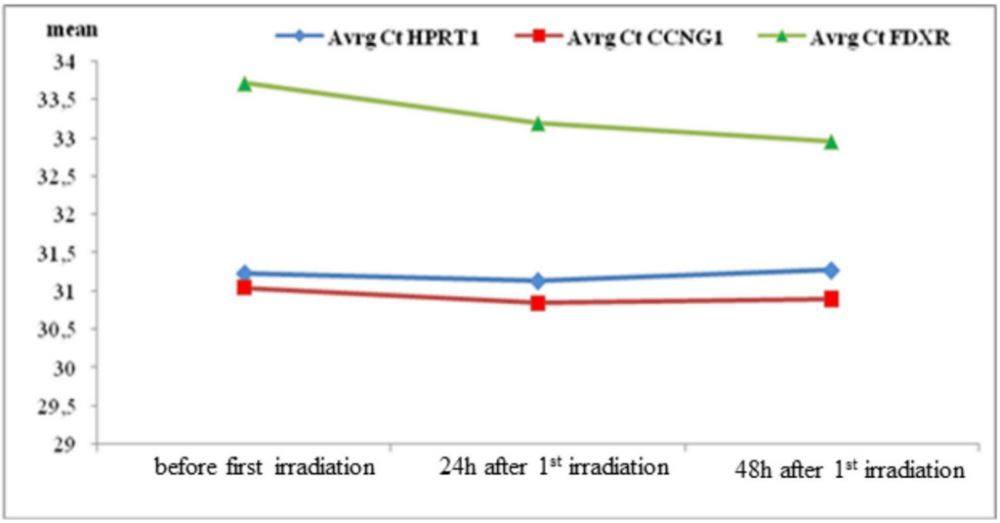
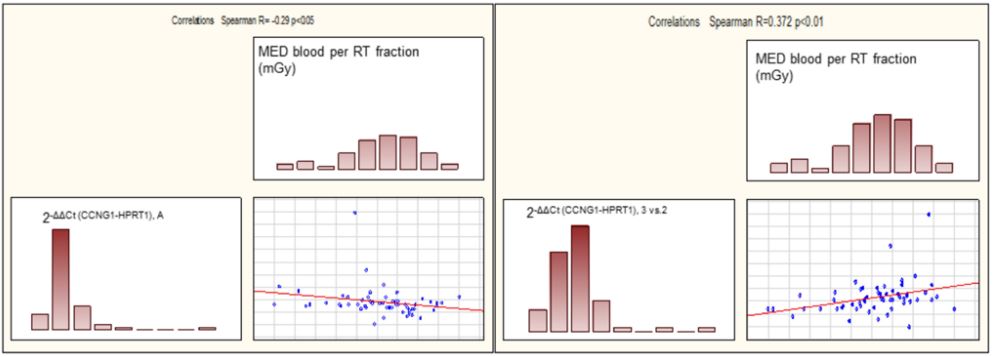
Table 1: General data for the patients (IG) of the clinical study.
| variable | n (%) |
|---|---|
| Gender | |
| male | 1 (1.75) |
| female | 56 (98.25) |
| Age | |
| mean ± SD | 55.3 ± 9.8 |
| surgery type | |
| 1 | 40 (71.43) |
| 2 | 11 (19.64) |
| 3 | 5 (8.93 |
Table 2: Inter-time point differences for ∆Ct (FDXR-HPRT1) (F=30.3, p<0.0001).
| Time point 1 | Time point 2 | p value |
|---|---|---|
| Before first RT fraction | 24h after first RT fraction | 0.01 |
| Before first RT fraction | 48h after first RT fraction | 0.00000 |
| 24h after first RT fraction | 48h after first RT fraction | 0.00000 |
Table 3: Fold changes at 24h, 48h after first RT fraction and between 24h and 48h after first RT frac- tion for CCNG1 and FDXR.
| Variable | mean±SD | median (IQR) | min – max | Std.error |
|---|---|---|---|---|
| 2 -∆∆Ct, A (CCNG1 - HPRT1) | 1.17±0.6 | 1.08 (0.93–1.22) | ||
| 2 -∆∆Ct, B (CCNG1 - HPRT1) | 1.23±0.5 | 0.19–2.80 | 0.063 | |
| 2-∆∆Ct (BvsA) (CCNG1-HPRT1) | 1.13±0.4 | 1.06 (0.86–1.26) | ||
| 2 -∆∆Ct, A (FDXR - HPRT1) | 1.49±0.6 | 0.08–2.91 | 0.079 | |
| 2 -∆∆Ct, B (FDXR - HPRT1) | 2.08±1.7 | 1.63 (1.34–2.44) | ||
| 2-∆∆Ct (BvsA) (FDXR-HPRT1) | 1.55±1.4 | 1.26 (0.99–1.64) |
Table 4: Comparison of changes of expression of FDXR and CCNG1 (CCNG1: n=57, Q=4000000, df=2, p<0.818731; FDXR: n=57, Q=6300000, df=2, p<0.042853).
| Compared time points | CCNG1 | FDXR | ||
|---|---|---|---|---|
| Expression change | n (%) | Expression change | n (%) | |
| 24h after first RT fraction/before RT | decreased | 22 (38.60) | decreased | 10 (17.54) |
| increased | 35 (61.40) | increased | 47 (82.46) | |
| 48h after first RT fraction irradiation/before RT | decreased | 19 (33.33) | decreased | 7 (12.28) |
| increased | 38 (66.67) | increased | 50 (87.72) | |
| 48h after irradiation/ 24h after irradiation | decreased | 21 (36.84) | decreased | 16 (28.07) |
| increased | 36 (63.16) | increased | 41 (71.93) | |
Discussion
RT of cancer patients requires continuous monitoring of RT effects and efficiency, but also following cellular responses due to the insufficiently known long-term consequences of IR in terms of cancer induction [24]. Follow-up during RT is most commonly performed by in vivo analysis of cytogenetic parameters, gene expression and mtDNA in peripheral blood samples at different time points of RT. So far, the “gold standard” of radiological biodosimetry is the DC aberration assay; also, microarray hybridization assays are frequently used. Lately, multitude of studies have confirmed the use of gene expression signatures in peripheral blood in prediction of IR dose and response using qRT-PCR [9,11,14,15,18]. This is a promising method, as it is minimally invasive, fast, high throughput and requires minimal expertise. Analyzing expression changes of two or more genes by means of qRT-PCR “buffers” the predictive ability by reducing the contribution of individual variations that may occur in a single gene [8], giving reliable results and thus offering more straightforward and cheaper alternative to microarray analysis. Genes regulated through DDR have been identified as reliable gene expression biomarkers of IR [10]. Two genes, FDXR and CCNG1 are shown to have strong responsiveness to IR ex vivo [15] and in vivo in previous studies [18]. FDXR is an essential gene for p53-dependent tumor suppression via IPR2 [19], while CCNG1 encodes cyclin G1, an intermediate by which p53 mediates its role as inhibitor of cellular proliferation. Both CCNG1 and FDXR were selected for this study as genes that can provide clear insight into the IR dose response and the associations between the gene expression levels (changes) and other disease-, treatment- and lifestyle-related confounding factors in breast cancer patients undergoing RT.
Investigation of gene expression profiles of CCNG1, FDXR and HPRT1 performed on peripheral blood leukocytes of 57 breast cancer patients treated with RT indicated slight up-regulation of CCNG1 and significant up-regulation of FDXR over time. Fold changes for CCNG1 had comparable values at 24h after first RT, 48h after second RT and between 48h and 24h after first RT, being in the range 1.13-1.23, which is in line with literature findings. FDXR fold changes were slightly lower than in literature findings, where IR-induced FDXR increased 1-3-fold after low (0.1-1.0 Gy) and 3-50-fold after >1-8 Gy X-irradiation. FDXR expression was increased for most of the patients at 24h and 48h after first RT when compared to before RT (82.46% and 87.72%), and for somewhat less patients when expression at 48h after RT was compared to expression at 24h after RT (71.93%). It is noteworthy that its expression was shown to be down-regulated in non-human primates (NHP) model, unlike in TBI patients, where it was strongly up-regulated [17]. FDXR is a ferredoxin reductase enzyme and its possible association with reactive oxygen species might imply questions regarding its specificity and further studies focused on this topic should be carried out [11].
Our findings are consistent with previous studies, where, for example, transcription of both FDXR and CCNG1 was significantly induced after first RT fraction [7]. Up-regulation of FDXR was observed 24h after IR with 0.02 Gy and 0.1 Gy and 48h after 0.1 Gy, but down-regulation was observed 48h after irradiation with 0.02 Gy [12]. More extremely, Manning et al. reported 46- fold increase in FDXR expression 24h after RT with 4 Gy [15]. Not only significant, but FDXR expression is also reported to be long-lasting, starting after first IR fraction in most cases and maintained during the 5-weeks RT course, with proportional IR dose-FDXR expression relation confirmed [17]. CCNG1 is also frequently reported to be up-regulated as a result of IR exposure, such as after first RT fraction (0.5-2.0h) and at the end of RT with cumulative doses in the range of 36.25-70.0 Gy [18]. No significant expression alterations for CCNG1 were observed in other study of ex vivo irradiation of peripheral blood gene expression analysis 6h, 12h, 24h and 48h after IR, but revealed dose-related up-regulation of FDXR [25]. In other study, CCNG1 showed significant up-regulation in endometrial cancer patients 24h and 48h after first RT of 1.8 Gy (equivalent to 0.19 Gy average MBD), but no significant up-regulations were detected in neck and head cancer patients 24h, 48h and 5 weeks from the beginning of RT, 2.0-2.121 Gy per RT fraction (equivalent to 0.09 Gy average mean blood dose) [9]. Also, low- (5-100 mGy) and high- (0.5-4 Gy) dose response was established for CCNG1 in ex vivo study [15]. Although larger response variation is observed for FDXR than for CCNG1 in this study (e.g. assessed 24h after irradiation with 0.5, 1.0, 2.0 and 4.0 Gy [15]), we observed comparable SD values, and therefore expression variability.
No significant correlation could be observed between FDXR fold changes and MBD. Fold changes in CCNG1 expression 24h after RT and between 48h and 24h after RT were significantly correlated with MBD. Decreased CCNG1 expression at 48h after first RT fraction when compared to 24h after first RT fraction were observed at lower MBD (48.28±12.9 mGy), and at higher MBD (58.18±8.6 mGy) CCNG1 expression at 48h post RT increased when compared to expression at 24h post RT.
We found the age of breast cancer patients as unimportant confounding factor, although CCNG1 expression significantly decreased at 48h compared to 24h post RT in younger patients (51.95±10.03 years) and increase in the older group (57.25±9.30 years). Therapy-related confounding factors such as TIV, surgery type (radical mastectomy with total or partial dissection of axillar lymph nodes, excision tumoris and quandratectomy with total or partial dissection of axillar lymph nodes), chemotherapy and hormone therapy started before RT could not be associated with FDXR and CCNG1 expression alterations. As most of the gene expression studies are performed in vitro or ex vivo, no literature data of possible association of FDXR and CCNG1 RTinduced expression alterations with TIV, surgery type, status of tumor recidive, and hormone therapy started before RT could not be found. There is limited evidence of FDXR expression alterations in breast cancer cell cultures responsive to 5-fluorouracil [26] and significant FDXR up-regulation in human breast MCF-7 and XR-75-1 cancer cells treated with topotecan [27], but such alterations are not associated with RT-induced alterations. In one study, no substantial impact of the most recent chemotherapy regimens received by the TBI patients on the capability of 15 gene-panel, including FDXR, in discriminating radiation dose levels [28]. Furthermore, to date, no genes are identified to be indicative for both IR and alkylator-based chemotherapy agents (here, cyclophosphamide) [29]. Our patients had prior exposure to either cyclophosphamide/doxorubicin hydrochloride or cyclophosphamide/epirubicin hydrochloride, as well as paclitaxel or docetaxel. 26 of them were on AP protocol (cyclophosphamide/doxorubicin hydrochloride/ paclitaxel), 18 were on EP protocol (cyclophosphamide/epirubicin hydrochloride/paclitaxel) and 1 of them was on ED protocol (cyclophosphamide/epirubicin hydrochloride/docetaxel).
Trastuzumab (Herceptin® ) is humanized anti-HER2 monoclonal antibody that binds to the extracellular domain IV of HER2, thereby inhibiting cell signaling implicated in cell proliferation motility, adhesion and survival. It is the first approved and still the most commonly used HER2-targeted therapy of HER2-positive breast cancer, substantially improving survival compared with chemotherapy alone. In vivo studies using HER2 overexpressing human breast cancer xenografts demonstrated marked enhancement of radiation efficacy when given Herceptin® [30], but expression alterations of radiosensitive genes were not studied to date. In our study, co-administration of target therapy Herceptin® (s.c. 600mg) could not be significantly associated with FDXR and CCNG1 changes. Single exception is CCNG1 expression changes 48h after first RT fraction compared to beginning of RT, where 5 patients (41.67%) treated with Herceptin® had increased and 7 patients (58.33%) had decreased CCNG1 expression, while more patients not treated with Herceptin® had increased CCNG1 expression (n=30, 73.17%) than decreased (n=11, 26.83%).
Analysis of the disease-related confounding factors revealed reoccurring tumor was found to be insignificant confounding factors affecting FDXR and CCNG1 expression alterations during RT. Significant difference was observed only for FDXR expression at 24h post compared to before RT; here, more patients without recidive had increased (n=42, 85.71%) than decreased FDXR expression (n=7, 14.29%), while the number of patients with recidive that had increased and decreased FDXR expression was equal (n=3). The FDXR fold change at 24h after first RT fraction was significantly lower for patients with hormonesensitive neoplasm (1.37 ± 0.5) compared to patients without (1.79±0.9). Presence of hormone-sensitive neoplasm, HER2- positive neoplasm and p53-positive neoplasm did not affect the FDXR and CCNG1 expression fluctuations during RT significantly, except for FDXR at 48h compared to 24h after first RT fraction, where fold change was significantly lower for patients with p53-positive neoplasm (1.57±1.6) than for patients without p53-positive neoplasm (2.14±1.4). Our findings could not be compared to any other finding due to the lack of scientific studies in this field.
Cautious interpretation of the results of our study is required due to multiple reasons. Of utmost importance is the extensive inter-individual variation in transcriptional response to IR exposure. Also, it should be considered that, in many cases, the lack of statistical significance might be a result of the limited number of patients involved in the study. Moreover, significant increase in HPRT1 expression was found recently in most malignant tissues (with highest average HPRT1 in breast tissue), which, however, was not the case in our study, where the increased target gene expression observed may be more significant than originally detected, as gene expression increase may be masked by the concomitant increase in cancer HPRT1 expression [23]. Further studies in the field may require the employment of different housekeeping genes in order to examine results reliability and accuracy. Additionally, more thorough examination of the gene expression changes within the first 24h after first RT may provide more beneficial insight into the time- and dose- dependent gene expression.
In conclusion, we report a remarkable up-regulation of FDXR to IR exposure at early time points in human leukocytes in vivo, and lack of significant expression alterations for CCNG1, demonstrating that probably FDXR is a more reliable markers of IR exposure in breast cancer patients. This is the first study investigating the association of two IR exposure biomarkers in human peripheral blood irradiated in vivo in the same patients with 11 different potential confounding factors in a single study. Further assessment found that some of the confounding factors can modify FDXR and CCNG1 expression and consequently could affect estimation of dose but to an extent that should not affect their use in monitoring IR exposure. However, some of them have to be considered when estimating the received IR dose. We are continuing to progress in using gene expression as a method for accurate and rapid assessment of radiation exposure and association between radiation responses and diseaseand therapy-related confounding factors.
Conflict of interest statement: None declared.
Acknowledgements: Not applicable.
References
- Sung H, Ferlay J, Siegel RL, Laversanne M, Soerjomataram I, et al. Global Cancer Statistics 2020: GLOBOCAN Estimates of Incidence and Mortality Worldwide for 36 Cancers in 185 Countries. CA: A Cancer Journal for Clinicians. 2021; 71: 209-49.
- Ferlay J, Ervik M, Lam F, Colombet M, Mery L, et al. Global Cancer Observatory: Cancer Today. Lyon, France: International Agency for Research on Cancer: 2020.
- Cardoso F, Kyriakides S, Ohno S, Penault-Llorca F, Poortmans P, et al. Early breast cancer: ESMO Clinical Practice Guidelines for diagnosis, treatment and follow-up. Annals of Oncology. 2019; 30: 1194-220.
- Early Breast Cancer Trialists’ Collaborative Group (EBCTCG). Effect of radiotherapy after mastectomy and axillary surgery on 10-year recurrence and 20-year breast cancer mortality: Metaanalysis of individual patient data for 8135 women in 22 randomised trials. The Lancet. 2014; 383: 2127-35.
- Whelan TJ, Julian JA, Shelley W, Perera F, Gulavita S. Long-Term Results of Hypofractionated Radiation Therapy for Breast Cancer. The New England Journal of Medicine. 2010; 362: 513-20.
- Christmann M, Kaina B. Transcriptional regulation of human DNA repair genes following genotoxic stress: Trigger mechanisms, inducible responses and genotoxic adaptation. Nucleic Acids Res. 2013; 41: 8403-20.
- Palumbo E, Piotto C, Calura E, Fasanaro E, Groff E, et al. Individual Radiosensitivity in Oncological Patients: Linking Adverse Normal Tissue Reactions and Genetic Features. Front Oncol. 2019; 9: 987.
- Paul S, Barker CA, Turner HC, McLane A, Wolden SL, et al. Prediction of In Vivo Radiation Dose Status in Radiotherapy Patients using Ex Vivo and In Vivo Gene Expression Signatures. Radiat Res. 2011; 175: 257-65.
- Tichy A, Kabacik S, O’Brien G, Pejchal J, Sinkorova Z, Kmochova A, et al. The first in vivo multiparametric comparison of different radiation exposure biomarkers in human blood. Woloschak GE, editor. PLoS ONE. 2018; 13: e0193412.
- Abend M, Badie C, Quintens R, Kriehuber R, Manning G, et al. Examining Radiation-Induced In Vivo and In Vitro Gene Expression Changes of the Peripheral Blood in Different Laboratories for Biodosimetry Purposes: First RENEB Gene Expression Study. Radiation Research. 2016; 185: 109.
- Kultova G, Tichy A, Rehulkova H, Myslivcova-Fucikova A. The hunt for radiation biomarkers: Current situation. International Journal of Radiation Biology. 2020; 96: 370-82.
- Knops K, Boldt S, Wolkenhauer O, Kriehuber R. Gene Expression in Low- and High-Dose-Irradiated Human Peripheral Blood Lymphocytes: Possible Applications for Biodosimetry. Radiation Research. 2012; 178: 304.
- Ghandhi SA, Smilenov LB, Elliston CD, Chowdhury M, Amundson SA. Radiation dose-rate effects on gene expression for human biodosimetry. BMC Med Genomics. 2015; 8: 22.
- Kabacik S, Mackay A, Tamber N, Manning G, Finnon P, et al. Gene expression following ionising radiation: Identification of biomarkers for dose estimation and prediction of individual response. International Journal of Radiation Biology. 2011; 87: 115-29.
- Manning G, Kabacik S, Finnon P, Bouffler S, Badie C. High and low dose responses of transcriptional biomarkers in ex vivo Xirradiated human blood. International Journal of Radiation Biology. 2013; 89: 512-22.
- Budworth H, Snijders AM, Marchetti F, Mannion B, Bhatnagar S, et al. DNA Repair and Cell Cycle Biomarkers of Radiation Exposure and Inflammation Stress in Human Blood. PLoS One. 2012; 7: e48619.
- O’Brien G, Cruz-Garcia L, Majewski M, Grepl J, Abend M, et al. FDXR is a biomarker of radiation exposure in vivo. Sci Rep. 2018; 8: 684.
- Cruz-Garcia L, O’Brien G, Donovan E, Gothard L, Boyle S, et al. Influence of confounding factors on radiation dose estimation in in vivo validated transcriptional biomarkers. Health Phys. 2018; 115: 90-101.
- Zhang Y, Qian Y, Zhang J, Yan W, Jung YS, et al. Ferredoxin reductase is critical for p53-dependent tumor suppression via iron regulatory protein 2. Genes Dev. 2017; 31: 1243-56.
- Kimura SH, Ikawa M, Ito A, Okabe M, Nojima H. Cyclin G1 is involved in G2/M arrest in response to DNA damage and in growth control after damage recovery. Oncogene. 2001; 20: 3290-300.
- Radonic A, Thulke S, Mackay IM, Landt O, Siegert W, et al. Guideline to reference gene selection for quantitative real-time PCR. Biochemical and Biophysical Research Communications. 2003; 313: 856-62.
- Townsend MH, Felsted AM, Ence ZE, Piccolo SR, Robison RA, et al. Failling from grace: HPRT is not suitable as an endogenous control for cancer-related studies. Mol Cell Oncol. 2019; 6: 1575691.
- Sedano JM, Ramos EI, Choudhari R, Harrison AL, Subramani R, et al. Hypoxanthine Phosphoribosyl Transderase 1 is upregulated, predicts clinical outcome and controls gene expression in breast cancer. Cancers. 2020; 12: 1522.
- Trenceva K, Eftimov A, Petlichkovski A, Jakjovski Z, Topuzovska S. CCNG1 and FDXR expression levels after radiation therapy in breast cancer patients. Academical Medical Journal. 2021; 1: 78-88.
- Li S, Lu X, Feng JB, Tian M, Wang J, et al. Developing Gender-Specific Gene Expression Biodosimetry Using a Panel of RadiationResponsive Genes for Determining Radiation Dose in Human Peripheral Blood. Radiation Research. 2019; 192: 399.
- Tsao DA, Chang HJ, Lin CY, Hsiung SK, Huang SE, et al. Gene Expression Profiles for Predicting the Efficacy of the Anticancer Drug 5-Fluorouracil in Breast Cancer. DNA and Cell Biology. 2010; 29: 285-93.
- Sinha BK, Tokar EJ, Bushel PR. Elucidation of Mechanisms of Topotecan-Induced Cell Death in Human Breast MCF-7 Cancer Cells by Gene Expression Analysis. Front Genet. 2020; 11: 775.
- Lucas J, Dressman HK, Suchindran S, Nakamura M, Chao NJ, et al. A Translatable Predictor of Human Radiation Exposure. Cordes N, editor. PLoS ONE. 2014; 9: e107897.
- Meadows SK, Dressman HK, Muramoto GG, Himburg H, Salter A, et al. Gene Expression Signatures of Radiation Response Are Specific, Durable and Accurate in Mice and Humans. Hoheisel J, editor. PLoS ONE. 2008; 3: e1912.
- Pietras R, Poen J, Gallardo D, Wongvipat P, Lee H, et al. Monoclonal antibody to HER-2/neureceptor modulates repair of radiation-induced DNA damage and enhances radiosensitivity of human breast cancer cells overexpressing this oncogene. Cancer Research. 1999 Mar 15; 59: 1347-55.