
SciBase Journals
SciBase Oncology
ISSN 2691-7785
- Article Type: Case Report
- Volume 1, Issue 2
- Received: Oct 06, 2023
- Accepted: Nov 01, 2023
- Published Online: Nov 08, 2023
Cardio-Cancer Risks Cross-Validation by Gaidai-Yakimov Reliability Method
Oleg Gaidai¹; Vladimir Yakimov²; Kelin Wang1*
1Shanghai Ocean University, Shanghai, China.
2Central Marine Research and Design Institute, Saint Petersburg, Russia.
*Corresponding Author: Kelin Wang
Shanghai Ocean University, Shanghai, China.
Email: m210811423@st.shou.edu.cn
Abstract
This study validates novel biological and health systems reliability method, in particular suitable for complex multi-dimensional public health and biological systems, versus the well-established bivariate bio-reliability method, being known to accurately assess bivariate dynamic system’s extreme contours. Contemporary reliability methods, that deal with spatio-temporal observations, do not always have advantage of coping easily with high-dimensional biosystems, along with complex cross-correlations various different system components. The suggested methodology coped with this challenge well. This study aimed to assess joint cardiovascular along with cancer diseases death rate risks, at any given time horizon, and in any region/country of interest, by means of applying novel Gaidai-Yakimov reliability method to raw clinical dataset. Multicentre, population-based, spatio-temporal, medical survey dataset analysis, based on novel bio-statistical method has been adopted. In this study, annual numbers of deaths, associated with cancer and cardiovascular diseases, recorded in all 195 world’s countries, have been selected. It has always been challenging to model such phenomena, due to bio-system non-stationarity, high-dimensionality, and cross-couplings between different biological or public health system’s components. Main purpose of this study was to benchmark Gaidai-Yakimov state-of-the-art technique, enabling optimal and efficient extraction of relevant statistical information from an underlying raw clinical dataset. Suggested methodology may be used for prognostics in various public digital health applications, based on their available clinical raw survey datasets.
Citation: Gaidai O, Yakimov V, Wang K. Cardio-Cancer Risks Cross-Validation by Gaidai-Yakimov Reliability Method. SciBase Oncol. 2023; 1(2): 1007.
Introduction
CVD (Cardiovascular disease) is a term being used to refer to a range of human diseases, affecting blood vessels and heart. Those include abnormal blood pressures (hypertensions); Heart attacks (coronary heart diseases); Strokes (cerebrovascular diseases); Heart failures; other numerous related heart disorders. NCI (National Cancer Institute) defines cancers as collection of serious diseases, when abnormal cells start-actively divide, and then spread to neighbouring tissues. Cancers may arise within various parts of human body resulting in a wide range of cancer types, in some cases spreading to other key parts of human body, through lymph and blood systems. CVDs along with cancers being 2 most major mortality reasons around the globe. Considering public system’s associated global risks, it makes sense to study bivariate statistics of both CVDs as well as cancers. This study considers public health and bio system, but it does not address health issues of individual patients. This study intends to contribute to contemporary public health and bio system research, but not clinical one; potential rationale could be an assessment of relative burdens on public health within various countries, given time-horizon of interest.
Statistical aspects of CVD and cancer diseases risks, along with the statistically relevant methods, has been receiving extensive attention in modern research community [1-14]; for CVD-related issues see [15-22]; for cancer-related issues see [33-51]. Generally, it being quite challenging to assess risk factors and reliability of realistic bio and health systems, as well as to predict excessive in situ mortality risks, under actual CVD and cancer disease conditions, using contemporary theoretical reliability and statistical methods [1,23-26]. Latter being typically due to bio and health system’s high-dimensionality, large number of random factors, governing bio and health system’s dynamics, yet system’s spread over extensive terrains. In general, reliability of complex biological, environmental or health systems may be assessed straightforwardly, by having either enough measurements, or by performing extensive direct MC (Monte Carlo) simulations. For CVD along with cancer diseases, available observational clinical datasets are often quite limited both in time, locations, as well as in dataset sizes, [1]. Given above-described challenges, authors have introduced here novel Gaida-Xing reliability methodology for bio and health systems, able to predict accurately CVD and cancer diseases excessive mortality risks. This study has been focused on CVD and cancer diseases spread dynamics over the globe [1,4,22], with special focus on complex cross correlations between various countries. Whole world has been hosen because of extensive public health observations, as well as widely available related research.
Reliability and statistics provide basis for lifetime modelling, typically using EVT (Extreme Value Theory), as a popular approach in both medical research and bio-medical engineering. In [15], authors proposed novel approach, utilizing PVF (Power Variance Function) copulas (Clayton, inverse Gaussian, Gumbel copulas, etc.), along with conditional sampling, used for survival analysis. For recent studies, discussing upper bounds distribution of life expectancy [16,19]. As there being not much statistical research done to assess contemporary risks associated with CVD and cancer diseases, including numerous heart and blood vessels diseases, authors introduced in this study novel reliability method, able to analyse excessive mortality episodes and their spatiotemporal spread, providing better indications and insight of possible future above-mentioned diseases spread. In our study CVD and cancer disease excessive mortality episodes have been viewed as unexpected/random incidents, that may possibly occur in any region/country, at any time-horizon, hence spatial spread being well accounted for. Non-dimensional scaling factor λ has been introduced, in order to predict latter CVD and cancer disease risks, given temporal return period and specific spatial area of interest.
Bio and health systems being subjected to various ergodic and cyclic environmental influences. Bio-process can be viewed as being intricately dependent on a number of bio/environmental parameters, whose temporal variation may be approximated/modelled, as ergodic or cyclic processes on their own.
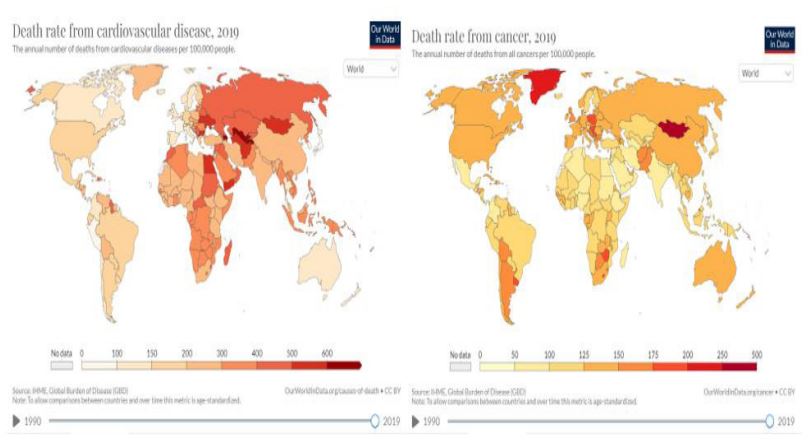
The incidence dataset of CVD and cancer diseases within one hundred-ninety-five world countries, during three recent decades 1990-2019 has been od frobtainm a public website [1]. This clinical dataset being given per each world’s country, the bio or health system, under consideration may be regarded as MDOF (Multi Degree of Freedom) dynamic bio-system, having highly cross-correlated national/regional components (or dimensions). This study assists managing global risks of future CVD and cancer diseases excessive mortality episodes, by prognosticating them, and hence it is being only focused on annually globally registered patient death-numbers, not on disease symptoms. All world countries have been accounted for in this study [1] (Figure 1).
Although studied dataset being only limited cardio-cancer dataset, the proposed bio-reliability technique may well be applied for any well documented diseases.
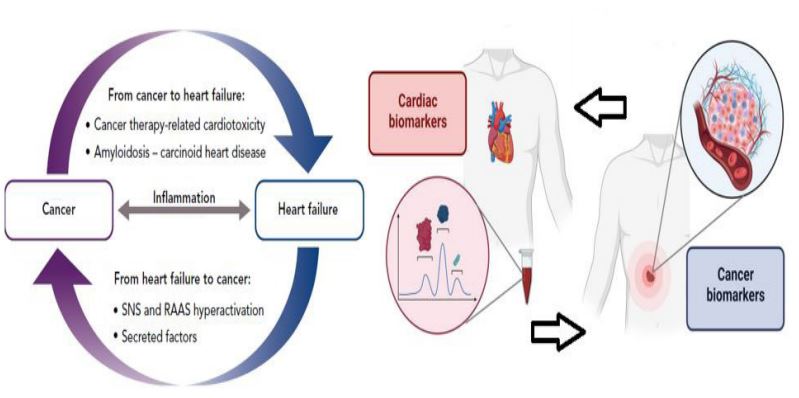
Heart failure and cancer being the 2 main causes of death in developed countries. Even though these 2 clinical entities seem to be distinct, they really share many of the same risk factors, symptoms, and pathophysiological pathways (inflammation, activation of the immunological and neurohormonal systems, metabolic abnormalities, endothelial dysfunction, etc.). Along with the well-known cardiotoxic effects of onco and cardiac treatment, cancers and heart failure are assumed to be related by a bi-directional interaction, with one disease favoring the other and vice versa (Figure 2).
Gaidai-Yakimov method
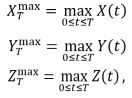
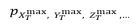
Consider MDOF public health or biological system’s vector (X(t),Y(t),Z(t),…), composed from bio or public health system critical/key components X(t),Y(t),Z(t),… that has been either observed, measured or numerically simulated over a sufficiently long (say, representative) observation time-period (0,T). Unidimensional (1D) bio or health system component’s global maxima denoted here as,
with sufficiently long (representative) time lapse T we basically mean large T, with respect to the bio-dynamic system autocorrelation, and relaxation times. Let X1,…,XNX be consequent in time local maxima of the biosystem component process X=X(t) at discrete, temporally increasing times

within (0,T). Identical type of definitions to follow for other MDOF components Y(t),Z(t),… Namely Y1,…,YN ); Z1,…,ZNZ etc. For the sake of simplicity, all bio or health system’s local maxima have been assumed to be positive. Then

being probability of dynamic biosystem’s survival, having critical (hazard) values of biosystem components, denoted as ηX, ηY, ηZ ,...; U being the logical unity operator «or»;
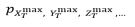
being biosystem’s joint PDF (probability density function) of individual biosystem component’s maxima. When biosystem’s NDOF (Number of Degrees of Freedom) being large, it being not always practically feasible to directly assess biosystem’s joint PDF
and hence biosystem’s probability P of survival. Latter probability P needs to be accurately assessed, as bio or health system’s expected lifetime, following Eq. (1). Bio-system’s 1D components X,Y,Z,… being re-scaled, as well as non-dimensionalized in a following manner
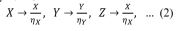
making all bio-system’s components non-dimensional, having now the same failure/hazard limits λ=1. Next, 1D biosystem’s components local maxima being merged into 1D temporally non-decreasing synthetic biosystem’s vector
following corresponding merged time-vector t1≤...≤tN, N≤NX+NY+NZ +... Every local maxima Rj being actually encountered by one of bio-system components: either X(t) or Y(t), or Z(t). Synthetic biosystem R vector has 0 data-loss, see Figure 3.
Results
This section applies the Gaidai-Yakimov approach, [61] to a bivariate (2D) Random bio-process Z(t)=(X(t),Y(t)). This bivariate process being made up of annually registered patient death numbers, X(t),Y(t), for CVD and cancer-related diseases respectively, which have been monitored synchronously, within representative time-lapse (0,T). Assume that N equidistant discrete temporal intervals t1,…,tN within observational time-lapse were used to collect samples (data points) (X1,Y1),…,(XN,YN) within (0,T). In this study, we investigate bivariate joint CDF (Cumulative Distribution Function) P(ξ,η):= Prob (XN≤ξ,YN≤η) of the 2D vector (X ̂N,Y ̂N ), having components XN=max{Xj ;j=1,…,N} , and YN=max{Yj ;j=1,…,N}. The latter example serves as an illustration of a dynamic two-dimensional (2D) biosystem. Critical (hazard) Thresholds were determined, using unidimensional extreme bio or health system component’s global maxima with specific return periods and risks/probabilities p. Following scaling has been done to combine both clinical/measured/observed timeseries X,Y following Eq. (2), Resulting in each of 2 biosystem components having the same failure/hazard limits equal to 1. Hence, by maintaining assembled local maxima in temporally increasing order, all bio or health system component’s local maxima, from each observed/measured time-series, were combined into a single 1D system’s vector R =(max{X1,Y1 },…,max{X1,Y1 }).
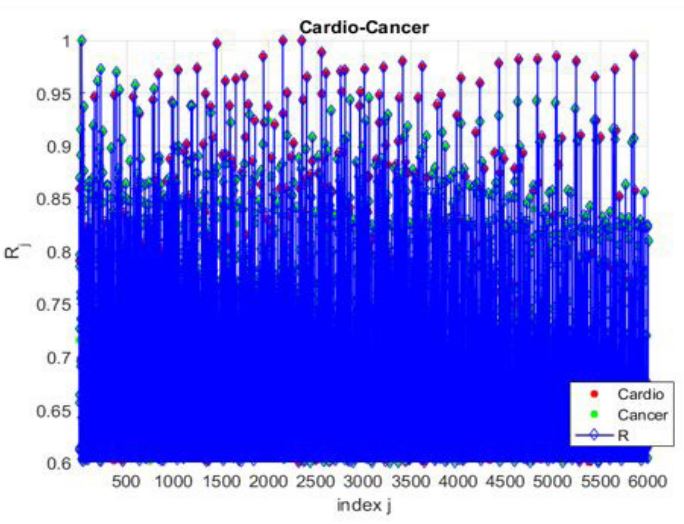
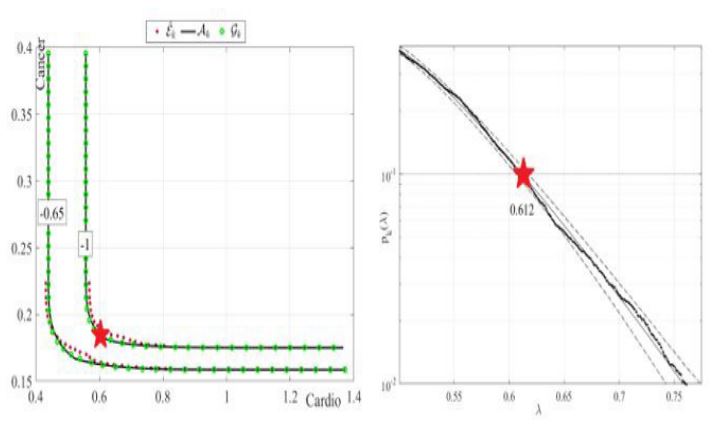
Figure 4 presents an example of cardio-cancer data, given as time-series.
Figure 5 presents modified bivariate Weibull method’s bivariate (2D) contours for cardio-cancer dataset. It being seen from Figure 5 there being an intrinsic inaccuracy, owing to the specific copula choice within the modified bivariate Weibull method, as it fits several Gumbel copulas to the measured clinical dataset. For more information on the modified bivariate Weibull methods, see [5-9]. Selected test-point being located on the p=10-1.5 contour line, and it was accurately verified by the modified bivariate Weibull method, given the bivariate failure point η_X=44000, η_Y=65. Then, confirming estimate from GaidaiYakimov approach has been compared to the same probability level p=10-1.5, matching the latter 2D contour line. It was seen that Gaidai-Yakimov method's predicted 95% CI (Confidence Interval) for the modified bivariate Weibull method probability level estimate was indeed accurate, [10-14]. Note that the above-described methodology, while unique, has practical benefits of effectively utilizing measured/observed/simulated datasets, since it can handle biosystem’s multi-dimensionality, and conduct accurate extrapolation, based on relatively scarce raw clinical datasets.
Poincare plot being defined as SODP (Second Order Difference Plot). Time-series based dataset’s quality may be observed/checked statistically, using SODP, by analysing underlying dataset’s successive differences. SODP assists statistical pattern recongnition through consecutive differences in the underlying raw time-series data. CEM (Circled Entropy Measurement) method calculated data fall over circled regions, see Figure 6. MATLAB script for feature SODP models has been shared for practitioners [62].
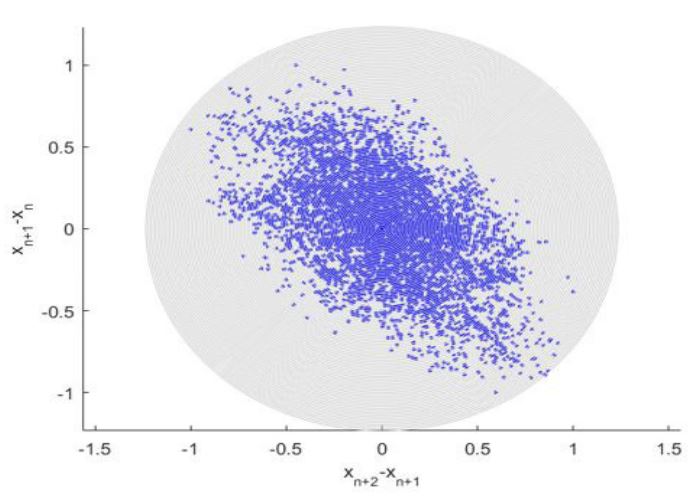
Figure 6 presents 2nd order SODP plot, such type of plots may be used to identify raw clinical dataset patterns, and compare them with other datasets, for example within a framework of entropy-based artificial intelligence (AI) recognition methods [52]. Figure 6 highlights relationship between annual registered CVD and cancer patient recorded death numbers. As an example, SODP pattern, extracted from reduced dataset can be compared with SODP pattern, extracted from full dataset, and certain judgement about reduced da-taset representativity and data quality may be drawn. While current study presents the MDOF biosystem’s reliability study by sub-asymptotic method, the commonly used EVT being asymptotic and being only 1DOF.
Classic contemporary health systems reliability approaches do not have advantage of easily dealing with observed clinical time-series, originating from complex bio-systems with highdimensionality and non-linear cross correlations between various bio-system’s components. The key advantages of GaidaiYakimov method, proposed here, being its capacity to analyze reliability and risks of high-dimensional non-linear dynamic bio and public health systems [53-60]. Despite apparent simplicity, the current work presents essentially novel multi-dimensional bio-modelling methodology, along with methodological route to apply epidemic/chronical disease forecasting, while bio or health system has not yet reached its critical/hazard levels.
Conclusion
The advantages of working with highly dimensional systems and complicated cross-correlation between different bio-system components readily are not provided by traditional dependability methodologies for clinical time series. The primary advantage of the suggested technique is its ability to analyze dependability of high-dimensional dynamic systems. In this study, time series representing the rates of cardiovascular and cancer death from accessible clinical datasets were presented. The theoretical support for the proposed approach has been developed. The complexity and high dimensionality of dynamic bio and health systems require the development of novel, accurate, yet robust techniques that can handle the limited clinical datasets that are currently available and utilize clinical data as effectively as possible, despite the appeal of using direct measurements or extensive Monte Carlo simulations to analyze biosystem's reliability. Only for one-dimensional dynamic systems, the method proposed in this article has previously been shown useful when used with a range of simulation models. In general, forecasts turned out to be rather accurate. This study has focused on a multi-dimensional bio-reliability strategy that is general-purpose, trust worthy, and user-friendly. The suggested method can be applied in a number of biological, medicinal, and health sectors. The offered clinical example in no way limits the potential uses of the suggested technique.
Declarations
Ethical approval: Not applicable.
Conflict of interests: Authors declare that they have no conflict of interest.
Author’s contribution: All authors contributed equally.
Funding: This study was implemented at the expense of a grant from the Russian Science Foundation (RSF) No 23-29- 00933 Development of a Probabilistic Simulation Model for Mechanical Interaction of Modern Ships with the Ice Cover to Ensure Safe Year-Round Arctic Navigation, https://rscf.ru/en/ project/23-29-00933/.
Data availability: Datasets used and analysed during the current study available from the corresponding author on reasonable request.
References
- Our world in data, https://ourworldindata.org/causes-of-death.
- Bertero E, Ameri P, Maack C. Bidirectional Relationship Between Cancer and Heart Failure: Old and New Issues in Cardio-oncology, Card Fail Rev. 2019; 5: 106-11. doi: 10.15420/cfr.2019.1.2.
- Chianca M, Panichella G, Fabiani I, et al. Bidirectional Relationship Between Cancer and Heart Failure: Insights on Circulating Biomarkers, Frontiers in Cardiovascular Medicine. 2022; 2022: 9. https://doi.org/10.3389/fcvm.2022.936654.
- Gaidai O, Cao Y, Xing Y, Wang J. Piezoelectric Energy Harvester Response Statistics, Micromachines. 2023; 14(2): 271. https://doi.org/10.3390/mi14020271.
- Gaidai O, Wang F, Wu Y, Xing Y, Medina A, Wang J. Offshore renewable energy site correlated wind-wave statistics, Probabilistic Engineering Mechanics. 2022; 2022(68). https://doi.org/10.1016/j.probengmech.2022.103207.
- Gaidai O, Yan P, Xing Y. Future world cancer death rate prediction, Scientific Reports. 2023; 13(1): 10.1038/s41598-023-27547-x.
- Gaidai O, Xu J, Hu Q, Xing Y, Zhang F. Offshore tethered platform springing response statistics, Scientific Reports, Vol. 12, www.nature.com/articles/s41598-022-25806-xGaidai, O, Xing Y, Xu, X, 2022, COVID-19 epidemic forecast in USA East coast by novel reliability approach, Research square. 2022. DOI: https://doi.org/10.21203/rs.3.rs-1573862/v1
- Xu X, Xing Y, Gaidai O, Wang K, Sandipkumar Patel K, Dou P, Zhang Z. A novel multi-dimensional reliability approach for floating wind turbines under power production conditions, Frontiers in Marine Science. 2022. https://doi.org/10.3389/fmars.2022.970081.
- Gaidai O, Xing Y, Balakrishna R. Improving extreme response prediction of a subsea shuttle tanker hovering in ocean current using an alternative highly correlated response signal, Results in Engineering. 2022. https://doi.org/10.1016/j.rineng.2022.100593.
- Cheng Y, Gaidai O, Yurchenko D, Xu X, Gao S. Study on the Dynamics of a Payload Influence in the Polar Ship, The 32nd International Ocean and Polar Engineering Conference, Paper Number: ISOPEI-22-342. 2022.
- Gaidai, O, Xing, Y. A Novel Multi Regional Reliability Method for COVID-19 Death Forecast, Engineered Science. 2022. DOI: 10.30919/es8d799.
- Gaidai O, Xing Y. A novel bio-system reliability approach for multi-state COVID-19 epidemic forecast, Engineered Science, DOI: 10.30919/es8d797Gaidai, O, Fu, S, Xing Y. Novel reliability method for multidimensional nonlinear dynamic systems, Marine Structures. 2022; 2022(86). https://doi.org/10.1016/j.marstruc.2022.103278.
- Gaidai O, Yan P, Xing Y. Future world cancer death rate prediction, Scientific Reports. 2023; 13(1): 10.1038/s41598-023-27547-x.
- Gaidai O, Xu J, Yan P, Xing Y, Zhang F, Wu Y. Novel methods for wind speeds prediction across multiple locations, Scientific reports. 2022; 12: 19614. https://doi.org/10.1038/s41598-022-24061-4.
- Tsao C, et al. Heart Disease and Stroke Statistics-2022 Update: A Report from the American Heart Association, Circulation, Vol. 2022; 145(8). https://doi.org/10.1161/CIR.0000000000001052.
- Smolina K, Wright FL, Rayner M, Goldacre MJ. Determinants of the decline in mortality from acute myocardial infarction in England between 2002 and 2010: linked national database study. BMJ 2012; 344: 8059.
- Balakrishna, R, Bjørnerud, T, Bemanian, M, Aune, D, & Fadnes, L. T. Consumption of Nuts and Seeds and Health Outcomes Including Cardiovascular Disease, Diabetes and Metabolic Disease, Cancer, and Mortality: An Umbrella Review. Advances in Nutrition. 2022.
- Mackay DF, Irfan MO, Haw S, Pell JP. Meta-analysis of the effect of comprehensive smoke-free legislation on acute coronary events. 2010; 96: 1525-1530.
- Cox B, Vangronsveld J, Nawrot TS. Impact of stepwise introduction of smokefree legislation on population rates of acute myocardial infarction deaths in Flanders, Belgium. 2014; 100: 1430-1435.
- Alzuhairi KS, Søgaard P, Ravkilde J, Gislason G, Køber L, TorpPedersen C. Incidence and outcome of first myocardial infarction according to gender and age in Denmark over a 35-year period (1978-2012). Eur Heart J Qual Care Clin Outcomes. 2015; 1: 72-78.
- Mirzaei M, Truswell AS, Taylor R, Leeder SR. Coronary heart disease epidemics: not all the same. 2009; 95: 740-746.
- NCDRF Collaboration. Trends in adult body-mass index in 200 countries from 1975 to 2014: a pooled analysis of 1698 population-based measurement studies with 19.2 million participants. Lancet 2016; 387: 1377-1396.
- Madsen HO, Krenk S, Lind NC. Methods of structural safety. Englewood Cliffs, Prentice-Hall Inc. 1986.
- Ditlevsen O, Madsen HO. Structural reliability methods. Chichester (World): John Wiley & Sons, Inc. 1996.
- Melchers RE. Structural reliability analysis and prediction. New York, John Wiley & Sons, Inc. 1999.
- Choi S-K, Grandhi RV, Canfield RA. Reliability-based structural design, London, Springer-Verlag. 2007.
- Pickands J. Statistical inference using extreme order statistics. Ann Stat. 1975; 3(1): 119-131.
- Zhao X. Extreme value modelling with application in finance and neonatal research. PhD Thesis, The University of Canterbury. Available. 2010. http://ir.canterbury.ac.nz/bitstream/10092/4024/1/thesis_fulltext.pdf.
- Zheng L, Ismail K, Meng XH. Freeway safety estimation using extreme value theory approaches: A comparative study. Accident Anal Prev. 2014; 62: 32-41. doi: 10.1016/j.aap.2013.09.006 PMID:24129319.
- McNeil AJ, Frey R, Embrechts P. Quantitative risk management. Concepts, techniques and tools.America. Princeton University Press. 2005.
- Patie P. Estimation of value at risk using extreme value theory. 2000 In: Talks in financial and insurance mathematics [Internet]. LaWorldnne Eidgenossische Technische Hochschule Zürich. 1855. [about 1 screen]. Available: http://www.math.ethz.ch/*patie/VaREvT.pdf, 2000.
- Songchitruksa P, Tarko Andrew P. The extreme value theory approach to safety estimation. Accident Anal Prev. 2006; 38: 811-822. PMID: 16546103.
- Siegel R, Miller K, Fuchs H, Jemal A. Cancer statistics, CA: A Cancer Journal for Clinicians. 2022. https://doi.org/10.3322/caac.21708.
- Yabroff KR, Wu, X C, Negoita S, Stevens J, Coyle L, Zhao J, et al. Association of the COVID-19 Pandemic with Patterns of Statewide Cancer Services. J Natl Cancer Inst. 2021.
- Surveillance, Epidemiology, and End Results (SEER) Program. SEER*Stat Database: Incidence- SEER 9 Registries Research Data with Delay- Adjustment, Malignant Only, November 2020 Submission (1975- 2018) Linked to County Attributes- Total U.S, 1969- 2018 Counties. National Cancer Institute, Division of Cancer Control and Population Sciences, Surveillance Research Program, Surveillance Systems Branch; 2021.
- Surveillance, Epidemiology, and End Results (SEER) Program. SEER*Stat Database: Incidence- SEER 18 Registries Research Data + Hurricane Katrina Impacted Louisiana Cases, November 2020 Submission (2000- 2018) Linked to County Attributes- Total U.S, 1969-2018 Counties. National Cancer Institute, Division of Cancer Control and Population Sciences, Surveillance Research Program, Surveillance Systems Branch. 2021.
- Surveillance Research Program. SEER*Explorer: an interactive website for SEER cancer statistics. National Cancer Institute; 2021. Accessed. 2021. seer.cancer.gov/explorer/.
- Surveillance, Epidemiology, and End Results (SEER) Program. SEER*Stat Database: Incidence- SEER Researc Limited-Field Data With Delay- Adjustment, 21 Registries, Malignant Only, November 2020 Submission (2000- 2018)- Linked To County Attributes- Time Dependent (1990- 2018) Income/Rurality, 1969-2019 Counties. National Cancer Institute, Division of Cancer Control and Population Sciences, Surveillance Research Program. 2021.
- Surveillance Research Program, Statistic Methodology and Applications. DevCan: Probability of Developing or Dying of Cancer Software. Version 6.7.9. National Cancer Institute. 2021.
- Surveillance, Epidemiology, and End Results (SEER) Program. SEER*Stat Database: North American Association of Central Cancer Registries (NAACCR) Incidence Data- Cancer in North America Analytic File, 1995-2018, With Race/Ethnicity, Custom File With County, American Cancer Society Facts and Figures Projection Project (which includes data from the Center for Disease Control and Prevention’s National Program of Cancer Registries, the Canadian Council of Cancer Registries’ Provincial and Territorial Registries, and the National Cancer Institute’s SEER Registries, certified by the NAACCR as meeting high-quality incidence data standards for the specified time periods). National Cancer Institute, Division of Cancer Control and Population Sciences, Surveillance Research Program; 2021. 8. Sherman R, Firth R, Charlton M, et al, eds. Cancer in North America: 2014-2018. Volume One: Combined Cancer Incidence for the United States, Canada and North America. North American Association of Central Cancer Registries, Inc. 2021.
- Sherman R, Firth R, Charlton M, et al, eds. Cancer in North America: 2014-2018. Volume Two: Registry- Specific Cancer Incidence in the United States and Canada. North American Association of Central Cancer Registries, Inc. 2021.
- Surveillance, Epidemiology, and End Results (SEER) Program. SEER*Stat Database: Mortality- All Causes of Death, Total U.S. (1969- 2019) Linked To County Attributes - Total U.S, 1969- 2019 Counties (underlying mortality data provided by the National Center for Health Statistics). National Cancer Institute, Division of Cancer Control and Population Sciences, Surveillance Research Program; 2021.
- Wingo PA, Cardinez CJ, Landis SH, et al. Long- term trends in cancer mortality in the United States, 1930- 1998. Cancer. 2003; 97(12): 3133-3275.
- Murphy SL, Kochanek KD, Xu J, Heron M. Deaths: Final Data for 2012. National Vital Statistics Reports. Vol 63, No. 9. National Center for Health Statistics. 2015.
- Steliarova- Foucher E, Stiller C, Lacour B, Kaatsch P. International Classification of Childhood Cancer, third edition. Cancer. 2005; 103: 1457-1467.
- Fritz A, Percy C, Jack A, et al, eds. International Classification of Diseases for Oncology. 3rd ed. World Health Organization. 2000.
- World Health Organization (WHO). International Statistical Classification of Diseases and Related Health Problems, 10th revision. Vol I- III. WHO. 2011.
- Surveillance Research Program. SEER*Stat software, version 8.3.8. National Cancer Institute. 2020.
- Surveillance Research Program. Joinpoint Regression Program version 4.9.0.1. National Cancer Institute. Statistical Research and Applications Branch. 2021.
- Mariotto AB, Zou Z, Johnson CJ, Scoppa S, Weir HK, Huang B. Geographical, racial and socio- economic variation in life expectancy in the US and their impact on cancer relative survival. PLoS One. 2018; 13: 0201034.
- Clegg LX, Fever EJ, Mistune DN, Fay MP, Hankey BF. Impact of reporting delay and reporting error on cancer incidence rates and trends. J Natl Cancer Inst. 2002; 94: 1537-1545.
- Yayık A, Kutlu Y, Altan G. Regularized HessELM and Inclined Entropy Measurement for Congestive Heart Failure Prediction. 2019. Cornell University, https://arxiv.org/abs/1907.05888.
- Gaidai O, Cao Y, Loginov S. Global cardiovascular diseases death rate prediction, Current Problems in Cardiology. 2023. https://doi.org/10.1016/j.cpcardiol.2023.101622.
- Gaidai O, Cao Y. Xing Y. Balakrishna R. Extreme springing response statistics of a tethered platform by deconvolution, International Journal of Naval Architecture and Ocean Engineering. 2023. https://doi.org/10.1016/j.ijnaoe.2023.100515.
- Gaidai O, Xing Y, Balakrishna R, Xu J. Improving extreme offshore wind speed prediction by using deconvolution, Heliyon. 2023. https://doi.org/10.1016/j.heliyon.2023.e13533.
- Gaidai O, Xing Y. Prediction of death rates for cardiovascular diseases and cancers, Cancer Innovation. 2023. http://doi.org/10.1002/cai2.47.
- Gaidai O, Cao Y, Xing Y, Balakrishna R. Extreme springing response statistics of a tethered platform by deconvolution, International Journal of Naval Architecture and Ocean Engineering. 2023. https://doi.org/10.1016/j.ijnaoe.2023.100515.
- Gaidai O, Xing Y, Balakrishna R, Xu J. Improving extreme offshore wind speed prediction by using deconvolution. 2023. Heliyon, https://doi.org/10.1016/j.heliyon.2023.e13533.
- Gaidai O, Xing Y. Prediction of death rates for cardiovascular diseases and cancers, Cancer. 2023. Innovation, http://doi.org/10.1002/cai2.47.
- Gaidai O, Wang F, Yakimov V. COVID-19 multi-state epidemic forecast in India. Proceedings of the Indian National Science Academy. 2023. 10.1007/s43538-022-00147-5.
- Gaidai O, Xing Y, Xu J, Balakrishna R. Gaidai-Yakimov reliability method validation for 10-MW floating wind turbines. Scientific Reports. 2023; 13(1). DOI: 10.1038/s41598-023-33699-7.
- https://github.com/apdullahyayik/time-series-analysis