
SciBase Journals
SciBase Oncology
ISSN 2996-3826
- Article Type: Research Article
- Volume 2, Issue 1
- Received: Feb 07, 2024
- Accepted: Mar 19, 2024
- Published Online: Mar 26, 2024
Differences Between Edges and Centers of Melanomas Using Vibrational Optical Coherence Tomography: The Effects of Critical Lesion Size
Frederick H Silver1,2*; Tanmay Deshmukh2; Kelly Ritter3; Hari Nadiminti3
1Department of Pathology and Laboratory Medicine, Robert Wood Johnson Medical School, Rutgers, the State University of New Jersey, New Brunswick, NJ 08854, USA.
2OptoVibronex, LLC., Ben Franklin Tech Ventures, Bethlehem, PA 18105, USA.
3Dermatology Department, Summit Health, Berkeley Heights, NJ 07922, USA.
*Corresponding Author: Frederick H Silver
Department of Pathology and Laboratory Medicine, Robert Wood Johnson Medical School, Rutgers, The State University of New Jersey, New Brunswick, NJ 08854, USA.
Tel: 1-610-428-2173;
Email: silverfr@rutgers.edu
Abstract
Vibrational Optical Coherence Tomography (VOCT) is a new technique to noninvasively characterize skin cancers. We have previously shown that skin cancers exhibit new mechanovibrational peaks at 80, 130, and 250-260 Hz. The 80 Hz peak appears to represent new cells including Cancer Associated Fibroblasts (CAFs) while the new 130 and 250-260 Hz peaks reflect thin blood vessels and fibrotic tissue, respectively. Epithelial cell derived cancers are characterized by the formation of CAFs that are stiffer than normal fibroblasts, induce deposition of new thin vasomimictry vessels, and influence fibrotic tissue formation by expression of lysyl oxidases. The results of this study suggest that small lesions less than 0.13 mm in diameter are found in clear margins of skin cancers while lesions greater than 0.21 mm in diameter are characteristic of cancerous tissue based on histopathology. The results of this study suggest that early detection of MEL lesions as small as 0.06 mm can be achieved noninvasively using VOCT. VOCT may provide a method of screening patients for skin cancer in remote areas where Dermatologists are unavailable through use of telemedicine.
Keywords: Vibrational optical coherence tomography; Melanoma; Cancer associated fibroblasts; Resonant frequency; Elastic modulus; Blood vessels; Skin cancer; Melanoma; Telemedicine.
Citation: Silver FH, Deshmukh T, Ritter K, Nadiminti H. Differences Between Edges and Centers of Melanomas Using Vibrational Optical Coherence Tomography: The Effects of Critical Lesion Size. SciBase Oncol. 2024; 2(1): 1011.
Introduction
Each year 5.4 million basal and squamous cell carcinomas and about 97,610 cases of melanoma are diagnosed in the US [1]. While the number of cases of melanoma diagnosed each year is a small fraction of the total skin cancer cases, most deaths due to skin cancer are a result of melanomas [2]. Diagnostic criteria for melanoma are based on a skin biopsy and evaluation of the lesion thickness, presence or absence of ulceration, mitotic rate, subtype of lesion, presence of immune cells, margin status, and presence or absence of cell surface markers, cancer cells, and lymph and blood vessels [https://www. cancer.net/cancer-types/melanoma]. Diagnosis of melanoma is sometimes very difficult even if the lesion is highly pigmented, since the lesion can have a blue-white veil, atypical vessels, and white shiny streaks [3]. The sharp increase in the diagnosis of skin cancer led to the development of technologies for skin cancer diagnosis including:
(1) Dermoscopy,
(2) Multiphoton microscopy,
(3) Reflectance confocal microscopy,
(4) Dermatofluoroscopy,
(5) Optical coherence tomograph,
(6) Line-field confocal optical coherence tomography, and
(7) Vibrational optical coherence tomography [4,12].
While these technologies have provided further insight into imaging and diagnostic criteria for skin cancer some of the instruments are expensive, come in direct contact with the skin, require highly trained personnel to operate, and are not simple to use during a routine skin examination. Ultimately, any noninvasive test to determine the type, margins, and depth of a skin cancer must be supported by subsequent histopathology. The ability to determine the malignancy of a lesion, its edges and depth in the initial office visit would provide several benefits. These benefits include immediate removal of the tumor with clean margins, a better understanding of the surgery required to treat the patient for head, neck, and facial lesions, and use of telemedicine to diagnose skin lesions by general practitioners in remote areas [12]. We have developed a noninvasive technique termed Vibrational Optical Coherence Tomography (VOCT) that yields a lesion image, cellular, blood vessel and fibrotic tissue composition, modulus (stiffness) measurements, and additional biomechanical information detailing skin lesions [7,12]. Clinical VOCT studies on Actinic Keratoses (AKs), Basal Cell Carcinomas (BCCs), Squamous Carcinomas (SCCs), and Melanomas (MELs) indicate that new resonant frequency peaks are seen at 80 Hz (AK, BCC, SCC, and MEL), 130 Hz (AK, BCC, SCC, and MEL), and at 260 Hz (BCC, SCC, and MEL). These peaks have different stiffnesses from those found in normal skin [8,10]. The location of these peaks can be mapped based on the pixel intensity versus depth plots [7,12]. In BCC, SCC, and MEL the new cells (80 Hz), blood vessels (130 Hz), and fibrotic tissue (250-260 Hz) are all located together in the lesion suggesting the coordinated deposition of these elements in the tumor microenvironment [8,12]. Previous reports using VOCT to analyze different skin cancers suggest that the 50, 80, 130, 150 and 260 Hz peaks represent normal skin cells (50 Hz), new cells (80 Hz), new thin blood vessels (130 Hz), normal blood vessels (150 Hz), and fibrotic tissue (250-260 Hz) [7,12]. The presence of a new cellular (80 Hz), blood vessel (130 Hz), and fibrotic peaks (250-260 Hz) are characteristic of cancerous lesions [7,11]. It is likely that the 80 Hz peak reflects Cancer Associated Fibroblasts (CAFs) in the tumor since they have been reported to be stiffer than skin fibroblasts [13,14]. CAFs are reported to enhance cell proliferation and induce tumor formation of epithelium and alter the composition and remodeling of the Extracellular Matrix (ECM) [15]. They are thought to be associated with formation of tumor vasculature (130 Hz peak), tumor aggressiveness, and a poor outcome prognosis [16]. CAFs stiffen the tumor (250-260 Hz peak) by enhanced cross-linkage of the ECM components after release of lysyl oxidase [17]. CAFs have been identified as playing a key role in areas such as tumor drug resistance [18]. The expression of commonly identified fibroblast markers on CAFs varies strongly between different subpopulations [18]. CAFs facilitate cancer cell migration and invasion via direct and indirect interactions [19]. They are involved in angiogenesis, invasion and metastasis, and extracellular matrix remodeling [20] exerting a physical force on cancer cells that enables their collective invasion [21]. In addition to altered collagen in the tumor environment, aligned fibronectin is a prominent feature of invasion sites in human prostatic and pancreatic carcinoma samples [22]. Tumor progression may entail a nonmutational conversion (“education”) of stromal p53, with an altered function of converting from tumor suppressive to tumor supportive behavior [23]. CAFs recruit infiltrating immune cells leading to immunosuppression of the tumor [24]. Some senescent cancer cells secrete metalloproteinase 2 (MMP-2) that promotes keratinocyte loss of cohesion and spreading of cells into the dermis [25]. The location of the 80, 130, and 250-260 Hz peaks in cancerous tissue can be used to noninvasively map clear margins and depths of lesions prior to conducting surgical excision. This will facilitate identification of lesion margins and depths and identify tissue that requires excision. It will also allow for noninvasive evaluation of the remaining tissue after the lesion is fully excised. If the lesion depth can be identified noninvasively, this will facilitate complete lesion removal. It will also allow clinicians during surgery to view the remaining skin for clear margins and provide additional information about the lesion for the Dermatopathologist. Histopathology can then be conducted on the excised skin to confirm that the margins are cancer free. The purpose of this paper is to evaluate morphological and biomechanical data on clear margins and cancerous areas of MELs using VOCT. The results of this study suggest that the 80, 130 and 250-260 Hz resonant frequency peaks characteristic of skin cancers are still present at the clear edges of cancerous lesions; however, the lesion cluster sizes at the clear margins are much smaller (<0.13 mm) than that of the cancerous lesion centers (> 0.21 mm). These results suggest that the presence of cancerous tumors and the clear lesion margins can be differentiated from normal skin noninvasively based on the size of the clusters and the peaks seen by VOCT.
Methods
Subjects: Normal skin was studied in vivo, and excised MEL biopsies in vitro using VOCT after informed consent was obtained, as reported previously [7,12]. The number of samples studied in each group is listed in Table 1. The cancerous lesions were examined at the center and along the clear edges by VOCT and histopathology. The edges were judged clear of cancer after a review by a board-certified dermatopathologist. Only lesions that were identified based on both camera (magnification of 10x) and OCT images were included in the study. The control subjects studied ranged in age from 21 to 71 years old and the cancer patients were 60 years of age and older.
OCT image collection and measurement of resonant frequency: Measurements on normal skin in vivo and on excisional biopsies in vitro were made using an OQ Labscope 2.0 modified with a 2 inch-diameter acoustic speaker as described previously [7,12]. Raw image OCT data were collected and processed using MATLAB software [7,2]. The measured resonant frequencies were converted into elastic modulus values using an empirical calibration equation (1) determined from VOCT and tensile measurements on soft tissue samples [7,12]. Based on equation (1) sample component displacements are inversely related to the Elastic modulus (E) in MPa of the tissue elements, where fn is the resonant frequency, and d is the sample thickness in m. Exd = 0.0651 x (fn)2 + 233.16 (1). Histopathology was conducted by a dermatopathologist after routine processing. OCT images of the samples were obtained in the scanning mode and were color-coded as discussed previously based on the pixel intensity [7,12]. Measurement of the resonant frequencies of the major components of skin were made using an OQ Labscope 2.0 (Lumedica, Inc., Durham, NC) that was modified by adding a 2 inchdiameter speaker placed about 2.5 inches above the area to be studied. Both infrared light at 840 nm and sinusoidal sound waves from the speaker between the frequencies of 30 and 300 Hz were applied transversely to the skin. The sound waves were applied at increments of 10 Hz along the axis of the light beam as described previously [7,12]. A plot of weighted displacement versus frequency resulted in a mechanovibrational spectrum of each sample. Weighted displacement versus frequency measurements for each specimen were corrected by dividing by the vibrations due to the speaker in the absence of the specimen. All weighted displacement data collected were normalized to the largest peak in the weighted displacement versus frequency spectrum. The peak frequency (the resonant frequency), fn, is defined as the frequency at which the displacement of each major skin component is maximized. Resonant frequencies for normal cells in skin (50 Hz), new CAFs (80 Hz), dermal collagen (100 Hz), new cancer associated blood vessels (130 Hz), dermal blood vessels (150 Hz), and skin fibrotic collagen (250-260 Hz) have been defined from results of previous studies [7,12].
Calculation of the average tissue elastic modulus: The average elastic modulus was determined by calculating the product of the weighted displacement peak height and the component elastic modulus values and then dividing by the sum of all the peak heights. The tissue average elastic modulus reported for each group is therefore weighted by the infrared light reflectivity which is proportional to the physical size of the component.
Statistics: The resonant frequency of normalized peak heights and moduli of normal skin and skin lesions were compared using an unpaired one-tailed Student’s t test. All p values were considered significant if they were less than 0.05.
Results
Figures 1 and 2 show camera and color-coded OCT images of lesion cross-sections, respectively for normal skin and a typical non-pigmented MEL. The VOCT measurements were made at the centers and at the clear edges of each MEL judged to be cancer free based on histopathology. The center of the MEL shown in Figure 2B lacks a continuous stratum corneum that is seen in yellow in the color-coded OCT image in normal skin (Figure 1B) and the basal epithelium are seen in pink in normal skin in Figure 1B. The center of the lesion in Figure 2B (right) has “large” lesions that appear as black spots indicated by the white arrows. Central lesions (black spots on right of Figure 2B) are consistent with clusters of cells, thin blood vessels, and fibrotic tissue previously reported [7,12] while the small black dots (Figure 2B with the red arrow) are found on clear margins based on histopathology. Weighted displacement versus frequency data was determined using VOCT for normal skin in vivo and excised MEL skin lesions in Figure 3. The major peak observed in the mechanovibrational spectrum of normal skin shown in Figure 3 occurred at 100 Hz (dermal collagen) while the peaks at 50, 80, 130 and 260 were small. Due to sample-to-sample variation in the mechanovibrational peak heights, peak heights of about 0.2 or less are considered background vibrations. These peaks have been assigned as normal cells (50Hz), new cancer associated cells (80 Hz), dermal collagen (100 Hz), new cancer associated blood vessels (130 Hz), normal blood vessels (150 Hz), and fibrotic collagen (250-260 Hz) [7,11]. The 80, 130 and 250-260 Hz peak heights for the center of melanomas appeared higher than Normal Skin (NS) peak heights. The 250-260 Hz peak heights for the MEL edges appeared smaller than for the center of the cancer but were not significantly different as shown in Table 2.
The major statistical differences between groups were: 50 Hz peak (normal skin cells) of the centers and edges were statistically different from normal skin and the edge was statistically different from the center. There were more 50 Hz cells present in the center of the lesion compared to the MEL edges and compared to normal skin. 80 Hz peak (CAFs) for both the edges and the center were statistically different than in normal skin but the numbers of cells were not statistically different between the center and edge. CAFs were present in the center and edges of the lesion while normal skin usually does not have a significant 80 Hz peak. 100 Hz peak (dermal collagen) was statistically different for MEL centers and edges compared to normal skin. This result suggests normal dermal collagen was prevalent at a higher level and was replaced with fibrotic tissue at the centers and edges of MELs. 130 Hz peak (new thin blood vessels) were statistically different than normal skin, but center and edges were not statistically different from each other. These results indicate that both the edges and centers of MELs have more thinner blood vessels than found in normal skin. 250-260 Hz peaks (fibrotic tissue) were statistically different for center and edges of MELs compared to normal skin but not different from each other. This result indicates that both the center and edges of MELs have more fibrotic tissue compared to normal skin. Figure 4 illustrates that the lesion diameters (black spots in Figure 2B) for the centers and edges of the MELs were statistically different with a p value of less than 0.001. The average of center lesion diameter was 0.21 mm and those of the clear edges were 0.13 mm. This result suggests that lesion diameter appears to be correlated with differentiating clear edges from the centers of MELs. Figure 5 is a plot of elastic modulus values for the mechanovibrational spectrum peaks seen in Figure 3 for normal skin and MEL center and edges. Note that the elastic modulus of the center and edges of MELs are not significantly different as shown by review of Table 3. Figure 6 shows a comparison of the average elastic modulus for normal skin and MEL centers and edges. The elastic modulus of normal skin is about 2.55 MPa and is significantly different from that for MEL edges and center with p values of 0.003 or less. The increased stiffness of MEL and other cancerous tissues reflect the deposition of fibrous tissue surrounding the CAFs.
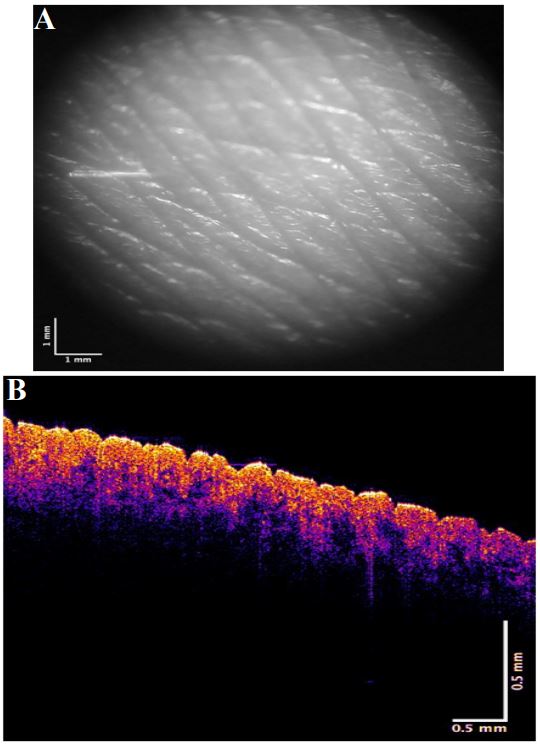
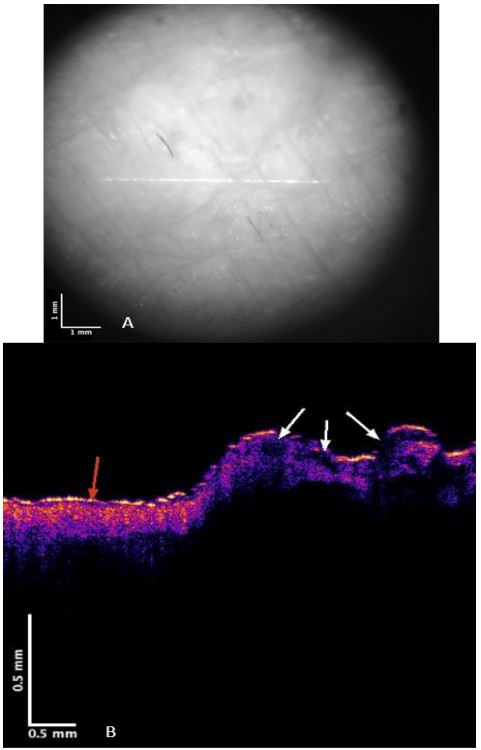
Table 1: Sample size for VOCT studies on normal skin, centers, and edges of melanomas.
| Type | Sample Size |
|---|---|
| Normal Skin | 24 |
| Melanoma Center | 16 |
| Melanoma Edge | 82 |
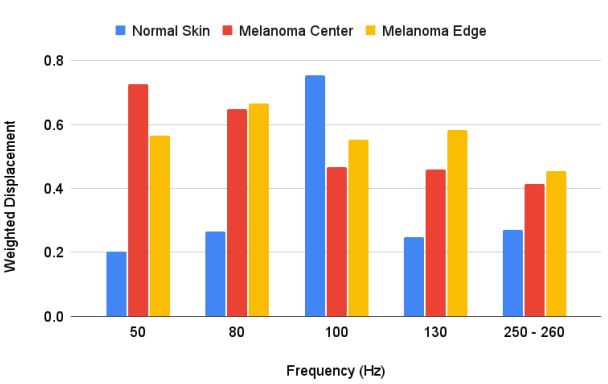
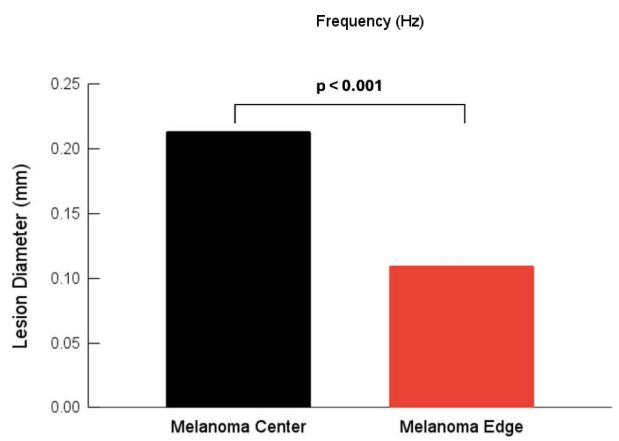
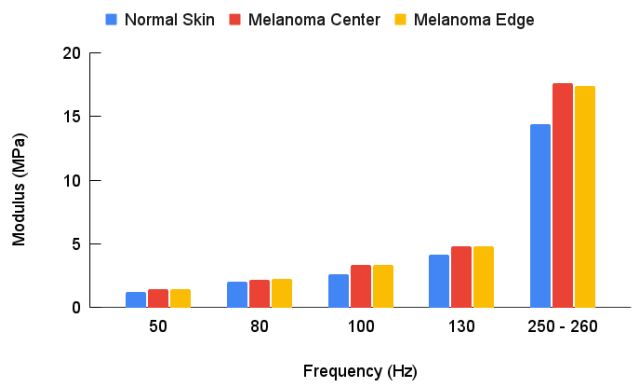

Table 2: Statistical comparison of P values for weighted dis- placement peak heights for normal skin, melanoma center, and edge based on VOCT studies. Note MEL edges and center peak heights are statistically different than those found in normal skin except for the 250-260 Hz.
| Normal Skin | Melanoma Edge | |
|---|---|---|
| 50 | Hz | |
| Melanoma Center | <0.001 | 0.03 |
| Melanoma Edge | <0.001 | - |
| 80 Hz | ||
| Melanoma Center | <0.001 | 0.41 |
| Melanoma Edge | <0.001 | - |
| 100 Hz | ||
| Melanoma Center | 0.002 | 0.11 |
| Melanoma Edge | 0.009 | - |
| 130 Hz | ||
| Melanoma Center | 0.01 | 0.08 |
| Melanoma Edge | <0.001 | - |
| 250-260 Hz | ||
| Melanoma Center | 0.08 | 0.33 |
| Melanoma Edge | 0.004 | - |
Table 3: Statistical comparisons of elastic modulus of normal skin, and melanomas. Note the elastic modulus of the center and edges of MEL lesions are not significantly different.
| 50 Hz | ||
|---|---|---|
| Melanoma Center | 0.002 | 0.43 |
| Melanoma Edge | <0.001 | - |
| 80 Hz | ||
| Melanoma Center | 0.11 | 0.25 |
| Melanoma Edge | 0.011 | |
| 100 Hz | ||
| Melanoma Center | <0.001 | 0.41 |
| Melanoma Edge | <0.001 | - |
| 130 Hz | ||
| Melanoma Center | 0.005 | 0.45 |
| Melanoma Edge | <0.001 | |
| 250-260Hz | ||
| Melanoma Center | <0.001 | 0.37 |
| <0.001 |
Discussion
Increased stiffness of cancerous cells and tissues has been reported in the literature to be a critical factor in cancer progression by regulating transcription factors [26]. It is now recognized that the increased cellular stiffness in cancers is due to CAFs that direct the deposition of thin blood vessels and fibrotic tissue. Fibrotic tissue is crosslinked by lysyl oxidases released into the tumor [27]. The results presented in this paper indicate that the edges and centers of different cancerous lesions are different from normal skin based on both the mechanovibrational peaks present and the average modulus of the tissue. While normal skin has smaller peaks for normal cells, blood vessels, and fibrous tissue, MELs have new cells that are stiffer (80 Hz peak), new blood vessels with lower stiffnesses (130 Hz peak), and new fibrous tissues (250-260 Hz). The normal skin has epithelium and fibroblasts that contribute to the 50 Hz peak. The number of “normal cells” in MEL lesions are increased based on the size of the 50 Hz peak. The increased 50 Hz peak is likely due to proliferation of fibroblasts and other skin cells that are recruited by CAFs to alter the tumor microenvironment that are not eliminated or reprogrammed [28]. CAFs that are present are derived from fibroblasts, epithelial cells, adipocytes, pericytes, or stellate cells [28] and appear to lead to formation of cells represented by the 80 Hz peak during lesion growth. The 80 Hz peak reflects the presence of cancer associated fibroblasts or cells derived from CAFs since they are reported to be stiffer than normal fibroblasts [13,14]. The correlation between the cells seen in the edge of MEL lesions in cell clusters in OCT images and those seen by histopathology of the MELs will ultimately give us a better understanding of what constitutes a clear margin. Understanding why the small lesions seen in OCT images are different from the large lesions seen in the center of MELs will provide a rapid method for screening tissue lesions. The existence of four different types of CAFs, namely, immunosuppressive, neoantigen presenting, myofibroblastic, and proliferative CAFs have been documented in the literature [29] and complicates the evaluation of cancerous lesions. Cancer Associated Fibroblasts (CAFs) are reported to enhance cell proliferation and induce tumor formation of epithelium [15]. Some of the markers for neoantigen-presenting CAFs, UBE2T and KPNA2, were confirmed to promote CAF invasiveness [29]. However, a variety of other markers have been identified in CAFs [18]. Mutation of the p53 tumor suppressor gene is associated with growth and survival advantages of CAFs [30]. Therefore, there are several types of “CAFs” that may have different functionalities in skin and the presence of one set of cell surface markers that define a CAF is not currently possible. It is important to attempt to understand which types of CAFs are most important in the aggressive reprogramming of the tumor environment. While CAFs alter the composition and remodeling of the Extracellular Matrix (ECM), they also change collagen assembly, fiber formation, and alignment of the new ECM that promotes invasion and migration of tumor cells and contribute to cancer progression [22]. One report indicates that ECM stiffness and composition jointly regulate the induction of malignant phenotypes in mammary epithelium [31]. CAFs can either facilitate or hinder cancer cell motility and invasiveness [32]. Upon conversion of fibroblasts and other cells into CAFs, these cells support the proliferation and survival of cancer cells and promote their aggressive features [23]. How CAFs alter the extracellular matrix that surrounds them is an important question that needs to be answered. The apparent decrease in dermal collagen in MELs and the reprogramming into stiff fibrotic networks by the action of lysyl oxidases suggests that collagen synthesis and deposition extracellularly is altered in these cancers. Are CAFs synthesizing fibrotic collagen or are they just altering the crosslinking of existing collagen in the tumor? Besides dermal collagen, CAFs facilitate laminin-1 synthesis, promoting the migration of tumor cells that express laminin receptors. Metalloproteinases produced by tumor cells cleave the extracellular domain of cell surface CD44, which creates an anti-adhesive pathway for tumor migration [33]. How the formation of lysyl (LOX) covalent cross-linkages, and stabilization of collagen and elastin fibers alters the tumor microenviroment is not totally clear [34]. Breast cancer cells in an in vitro invasion model showed high levels of LOX mRNA in highly invasive cells but not in cells from poorly invasive breast cancers [35]. LOX functions as a promoter of angiogenesis [36] and enhances tumor angiogenesis in several types of cancer [36]. LOX expression is found to be correlated with release of increased levels of Vascular Endothelial Growth Factor (VEGF) and platelet-derived growth factor [37,38]. Other reports suggest that fibroblasts differentiate into CAFs and exert a contractile force, leading to increased intratumoral pressure [16]. An important question that needs to be answered is whether the stresses that are exerted by CAFs on the tumor cells and extracellular matrix upregulate integrin mediated mechanotransduction. Enhanced cross-linkage of the ECM components by CAFs stiffen the ECM [16] and modify the vascularity of the lesion. Tumor cells integrate into the endothelium or even mimic and replace them with Vasculogenicmimicry (VM) vessels. Malformed endothelial lined VMs are typical of tumor tissue [16] and may reflect the reduce stiffness (130 Hz peak) seen in thin blood vessels found in cancerous lesions [7,11]. Is the formation of thin tumor associated vessels a by-product of alteration in mechanotransduction pathways or is it part of up-regulation of mechanotransduction by tumor stresses? Since VM is associated with tumor aggressiveness, and a poor outcome prognosis [15] the origins of VM are important. VM channels are typically characterized as an intricate meshwork of micro-channels of irregular diameters that anastomose with endothelium-lined blood vessels; in contrast they are devoid of endothelial markers such as CD31 [15]. The 130 Hz peak appears to be associated with VMs and may reflect the invasiveness of a tumor. However, further studies are needed to compare the location of the 130 Hz peak in the OCT images and in sections of active cancers. In breast cancers, metastatic epithelial cells migrate in direct contact along dense stromal collagen fibers [39]. They contract and localize collagen, followed by tumor growth and expansion (stretching) of the collagen matrix leading to matrix reorganization [40]. CAF-derived fibroblasts grown on cellular matrices from prostate cancer patients had increased elastic modulus and a highly aligned F actin cytoskeleton compared with matrices containing normal fibroblasts [13]. In addition to the cellular phenotype and the gene expression profile, the mechanical properties of new ECM deposited could potentially be used for phenotyping of CAFs and lead to new diagnostic approaches [13]. Normally epithelial lined tissues and stromal extracellular matrix are physically separated by a basement membrane. The transition from normal epithelium to invasive carcinoma involves activation of local host stroma [41]. In cervical cancer metalloproteinase MMP-2 is secreted and MMP synthesis is facilitated, leading to degradation of the basement membrane [33]. The EpithelialMesenchyme Transition (EMT) is a process wherein epithelial cells undergo a phenotypic shift towards a mesenchymal state. EMT has been associated with both physiologic regeneration and pathological fibrotic conditions that occur in skin cancer [42]. For this reason, it is important to establish if the difference between EMT in normal wound healing and that associated with cancerous tissue proliferation.
Study limitations: Limitations of the study include the possibility that acoustic vibrations from the center of the lesions may have influenced vibrations measured at the lesion edges. This may have resulted in an increase in the size of the 80, 130, and 250-260 Hz peaks measured for some edges. Further studies are required to correlate the histopathology images with OCT images on MELs to relate the components seen by histopathology to those seen in cell clusters in OCT images. This will provide additional information to better identify the components found in both large and small MEL lesions.
Conclusion
In summary, melanocytic cell cancers are associated with formation of CAFs that are found in MELs. CAFs appear to induce deposition of new thin VM vessels and fibrotic tissue in the tumor microenvironment. The results of this study suggest that the maturation of CAFs from small lesions less than 0.13 mm in diameter found in clear margins to those greater than 0.21 mm in diameter characteristic of cancer may involve changes in cell surface markers, VM formation, LOX crosslinking of new stiffer collagen, and expression of metalloproteinases. The results of this study suggest that early detection of MEL cell clusters as small as 0.06 mm can be rapidly achieved using VOCT. VOCT studies in conjunction with histopathology may provide additional information on the composition of small and large MEL lesions. Remote use of VOCT provides the potential of screening patients for skin cancer in areas where Dermatologists are in short supply [12].
Declarations
Acknowledgements: The authors would like to thank Albert Alhatem, MD for helpful discussions related to melanoma histopathology.
Funding: This work was funded by a Genesis Grant from Rutgers, the State University of New Jersey.
Conflicts of interest: FHS is a stockholder and TD is an employee of OptoVibronex, LLC.
References
- American Cancer Society Cancers.org accessed 1/25/2024.
- www.cancer.net/cancer-types/melanoma accessed 1/25/2024.
- Lallas A, Paschou E, Manoli SM, Papageorgiou C, Spyridis I, Liopyris K, Bobos M, Moutsoudis A, Lazaridou E, Apalla Z. Dermatoscopy of melanoma according to type, anatomic site and stage. Ital J Dermatol Venerol. 2021; 156(3): 274-288. doi: 10.23736/S2784-8671.20.06784-X. Epub 2020 Dec 14. PMID: 33314891.
- Owida HA. “Developments and Clinical Applications of Noninvasive Optical Technologies for Skin Cancer Diagnosis.” Journal of Skin Cancer. 2022.
- Dubois A, Levecq O, Azimani H, Siret D, Barut A, Suppa M, Del Marmol V, Malvehy J, Cinotti E, Rubegni P, Perrot JL. Line-field confocal optical coherence tomography for high-resolution noninvasive imaging of skin tumors. J Biomed Opt. 2018; 23(10): 1-9. doi: 10.1117/1.JBO.23.10.106007.
- Silver FH, Deshmukh T, Benedetto D, Kelkar N. Mechano‐vibrational spectroscopy of skin: Are changes in collagen and vascular tissue components early signs of basal cell carcinoma formation? Skin Research and Technology. 2021; 27(2): 227-33. doi.org/10.1111/srt.12921.
- Silver FH, Deshmukh T, Kelkar N, Ritter K, Ryan N, Nadiminti H. The “Virtual Biopsy” of Cancerous Lesions in 3D: Non-Invasive Differentiation between Melanoma and Other Lesions Using Vibrational Optical Coherence Tomography. Dermatopathology. 2021; 8(4): 539-51. https://doi.org/10.3390/dermatopathology8040058.
- Silver FH, Deshmukh T, Ryan N, Romm A, Nadiminti H. “Fingerprinting” Benign and Cancerous Skin Lesions Using Vibrational Optical Coherence Tomography: Differentiation among Cancerous Lesion Types Based on the Presence of New Cells, Blood Vessels, and Fibrosis. Biomolecules. 2022; 12(10): 1332. doi.org/10.3390/biom12101332.
- Silver FH, Desmukh T, Mercedes-Gonzalez, M. (2023) Use of Vibrational Optical Coherence Tomography to Noninvasively Differentiate Between Benign Fibrotic Tissue and Fibrosis Associated with Melanoma, 21st Century Pathology. 2023; 3(1): 139.
- Silver FH, Deshmukh T, Kelkar N, Ritter K, Ryan N, Nadiminti, H. The “Virtual Biopsy” of Cancerous Lesions in 3D: Non-Invasive Differentiation between Melanoma and Other Lesions Using Vibrational Optical CoherenceTomography. Dermatopathology. 2021; 8: 539-551. https://doi.org/10.3390/dermatopathology8040058.
- Silver FH, Mesica A, Gonzalez-Mercedes M, Deshmukh, T. Identification of Cancerous Skin Lesions Using Vibrational Optical Coherence Tomography (VOCT): Use of VOCT in Conjunction with Machine Learning to Diagnose Skin Cancer Remotely Using Telemedicine Cancers. 2023; 15: 156. https://doi.org/10.3390/cancers15010156.
- Jaeschke A, Jacobi A, Lawrence MG, Risbridger GP, Frydenberg M, Williams ED, et al. Cancer-associated fibroblasts of the prostate promote a compliant and more invasive phenotype in benign prostate epithelial cells. Materials Today Bio 8 100073. doi.org/10.1016/j.mtbio.2020.100073. 2020.
- Ansardamavandi A, Tafazzoli-Shadpour M. The functional cross talk between cancer cells and cancer associated fibroblasts from a cancer mechanics perspective. Biochim Biophys Acta Mol Cell Res. 2021; 1868(11): 119103. doi: 10.1016/j.bbamcr.2021.119103. Epub 2021 Jul 20. PMID: 34293346.
- Ao M, OE Franco, OE, Park D, Raman D, Williams K, Hayward SW, Cross-talk between paracrine-acting cytokine and chemokine pathways promotes malignancy in benign human prostatic epithelium. Canc. Res. 2007; 67: 4244-4253. doi.org/10.1158/0008-5472.can-06-3946.
- Cao Z, Shang B, Zhang G, Miele L, Sarkar FH, Wang Z, et al. Tumor cell-mediated neovascularization and lymphangiogenesis contrive tumor progression and cancer metastasis. Biochim Biophys Acta. 2013; 1836(2): 273-86.doi: 10.1016/j.bbcan.2013.08.001.
- Cavaco, Rezaei M, Niland S, Eble JA. Collateral Damage Intended-Cancer-Associated Fibroblasts and Vasculature Are Potential Targets in Cancer Therapy. Int J Mol Sci. 2017; 18: 2355. doi:10.3390/ijms18112355.
- Nurmik M, Ullmann P, Rodriguez F, Haan S, Letellier E. In search of definitions: Cancer-associated fibroblasts and their markers Int J Cancer. 2020; 146: 895-905.
- Augsten M. Cancer-associated fibroblasts as another polarized cell type of the tumor microenvironment. Front Oncol. 2014; 4: 62. doi: 10.3389/fonc.2014.00062. PMID: 24734219; PMCID: PMC3973916. M. Cancer-associated fibroblasts as another polarized cell type of the tumor microenvironment. Front Oncol. 2014; 4: 62. doi: 10.3389/fonc.2014.00062. PMID: 24734219; PMCID: PMC3973916.
- Mao X, Xu J, Wang W, Liang C, Hua J, Liu J & Shi S. Crosstalk between cancer-associated fibroblasts and immune cells in the tumor microenvironment: new findings and future perspectives. Molecular cancer. 2021; 20(1): 1-30.
- Labernadie A, Takuya Kato, Agustí Brugués, Xavier Serra-Picamal, Stefanie Derzsi, Esther Arwert, et al. A mechanically active heterotypic E-cadherin/N-cadherin adhesion enables fibroblasts to drive cancer cell invasion. Nat Cell Biol. 2017; 19(3): 224-237. doi:10.1038/ncb3478.
- Erdogan B, Ao M, White LM, Means AL, Brewer BM, Yang L, et al. Cancer associated fibroblasts promote directional cancer cell mgration by aligning fibronectin. J Cell Biol. 2017; 2216: 3799-3816. doi.org/10.1083/jcb.201704053.
- Arandkara S, Furtha N, Elishaa Y, Natarajb NB, Kuipc H, Yarden Y, et al. Altered p53 functionality in cancer-associated fibroblasts contributes to their cancer supporting features. PNAS. 2018; 115: 6410-6415. doi/10.1073/pnas.1719076115.
- Monteran L, Erez N. The Dark Side of Fibroblasts: Cancer-Associated Fibroblasts as Mediators of Immunosuppression in the Tumor Microenvironment. Front Immunol. 2019; 10: 1835. doi: 10.3389/fimmu.2019.01835.
- Hassona Y, Cirillo N, Heesom K, Parkinson E K & Prime S S. Senescent cancer-associated fibroblasts secrete active MMP-2 that promotes keratinocyte dis-cohesion and invasion. British journal of cancer. 2014; 111(6): 1230-1237.
- Ishihara S, Haga H. Matrix Stiffness Contributes to Cancer Progression by Regulating Transcription Factors. Cancers (Basel). 2022; 14(4): 1049. doi: 10.3390/cancers14041049. PMID: 35205794; PMCID: PMC8870363.
- Yang D, Liu J, Qian H & Zhuang Q. Cancer-associated fibroblasts: from basic science to anticancer therapy. Experimental & Molecular Medicine. 2023; 55(7): 1322-1332.
- Glabman, Raisa A, Peter L. Choyke, and Noriko Sato. “Cancerassociated fibroblasts: Tumorigenicity and targeting for cancer therapy.” Cancers 14.16 (2022); 3906.
- Kim D, Kim JS, Cheon I, Kim SR; Chun SH, Kim JJ, et al. Identification and Characterization of Cancer Associated Fibroblast Subpopulations in Lung Adenocarcinoma. Cancers. 2022; 14: 3486. doi.org/ 10.3390/cancers14143486.
- Greenblatt MS, Bennett WP, Hollstein M, Harris CC. Mutations in the p53 tumor suppressor gene: clues to cancer etiology and molecular pathogenesis. Cancer Res. 1994; 54(18): 4855-78. PMID: 8069852].
- Chaudhuri O, Koshy ST, Branco da Cunha B, Shin J-W, Verbeke CS, Allison KH, et al. Extracellular matrix stiffness and composition jointly regulate the induction of malignant phenotypes in mammary epithelium. Nat Mater. 2014; 13: 970-978. doi.org/10.1038/nmat4009].
- Bu L, Baba H, Yoshida N, Miyake K, Yasuda T, UchiharaT, et al. biological heterogeneity and versatility of cancer associated fibroblasts in the tumor microenvironment. Oncogene. 2019; 38: 4887-4901.
- Fullár A, Dudás J, Oláh L, Hollósi P, Papp Z, Sobel G. Remodeling of extracellular matrix by normal and tumor-associated fibroblasts promotes cervical cancer progression. BMC Cancer. 2015; 15: 256. doi: 10.1186/s12885-015-1272-3.
- Liburkin-Dan T, Toledano S, Neufeld G. Lysyl Oxidase Family Enzymes and Their Role in Tumor Progression. Int J Mol Sci. 2022; 23: 6249. doi.org/10.3390/ ijms23116249.
- Kirschmann DA, Seftor EA, Fong SF, Nieva DR, Sullivan CM, Edwards EM et al. molecular role for lysyloxidase in breast cancer invasion. CancerRes. 2002; 62: 4478-4483.
- Baker AM, Bird D, Welti JC, Gourlaouen M, Lang G, Murray GI, et al. Lysyl oxidase plays a critical role in endothelial cell stimulation to drive tumor angiogenesis. Cancer Res. 2012; 73: 583-594. doi: 10.1158/0008-5472.CAN-12-2447.
- Shih YH, Chang KW, Chen MY, Yu CC, Lin DJ, Hsia SM, et al. Lysyl oxidase and enhancement of cell proliferation and angiogenesis in oral squamous cell carcinoma. Head Neck. 2012; 35: 250-256. doi: 10.1002/hed.22959.
- Grunwald H, Hunker KL, Birt I, Aviram R, Zaffryar-Eilot S, Ganesh SK, et al. Lysyl oxidase interactions with transforming growth factor-β during angiogenesis are mediated by endothelin 1. FASEB J. 2021; 35: 21824. doi: 10.1096/fj.202001860RR.
- Wang W, Wyckoff JB, Frohlich VC, Oleynikov Y, Huttelmaier S, Zavadil J, et al. Single cell behavior in metastatic primary mammary tumors correlated with gene expression patterns revealed by molecular profiling. Cancer Res. 2002; 62(21): 6278-6288.
- Provenzano PP, Eliceiri KW, Campbell JM, Inman DR, White JG, Keely PJ, Collagen reorganization at the tumor-stromal interface facilitates local invasion, BMC Med. 2006; 4: 38. doi.org/10.1186/1741-7015-4-38.
- Tomakidi P, Mirancea N, Fusenig NE, Herold-Mende C, BoschFX, Breitkreutz D. Defects of basement membrane and hemidesmosome structure correlate with malignant phenotype and stromal interactions in HaCaT-Ras xenografts. Differentiation. 1999; 64(5): 263-75.
- Van De Water L, Varney S, Tomasek JJ. Mechanoregulation of the Myofibroblast in Wound Contraction, Scarring, and Fibrosis: Opportunities for New Therapeutic Intervention. Adv Wound Care (New Rochelle). 2013; 2(4): 122-141. doi:10.1089/wound.2012.0393.