
SciBase Journals
SciBase Radiology & Medical Imaging
- Article Type: Research Article
- Volume 1, Issue 1
- Received: Nov 12, 2024
- Accepted: Dec 23, 2024
- Published Online: Dec 30, 2024
Prevalence of Bony Dehiscences in Angle-Class I, II/1, and II/2 Using CBCT
Oliver Paul Allemann; Johannes Weigang; Axel Bumann*
Department of Craniofacial Sciences, University of Southern California, Los Angeles, CA 90089, USA.
*Corresponding Author: Axel Bumann
Department of Craniofacial Sciences, University of Southern California, Los Angeles, CA 90089, USA.
Email: ab@kfo-berlin.de
Abstract
Objectives: The aim of this study was to investigate and compare the prevalence and extent of alveolar dehiscences in patients with Class II/1 and Class II/2 malocclusions, as compared to those with normal Class I occlusion.
Material and methods: The analysis involved 207 CBCT files (Voxel-Size 200-250 μm) of patients with either a Class I, II/1 or II/2, that were retrieved from the database of a radiological institute. The DICOM-Software In-Vivo 5 (Anatomage Inc, San Jose, California) was used to measure the periodontal bone level for each periodontium on both the buccal and lingual sides, from the cemento-enamel-junction to the crestal alveolar bone. A total of 5547 buccal and 5550 oral measurements were retrieve. A bone loss >2 mm was classified as a dehiscence.
Results: Approximately 50% of the teeth within all examined malocclusions exhibited buccal dehiscences greater than 2 mm in size. Dehiscences were significantly bigger on the buccal side in all angle classes. Buccal alveolar dehiscences were most frequently observed on the maxillary canines and mandibular first premolars. Maxillary incisors in Class II/1 and II/2 showed no significant difference in dehiscence size on the buccal side.
Conclusion: Individual assessment of the periodontal bone level should be considered prior to buccal tooth movement or tipping due to the generally high prevalence of pretherapeutic bony dehiscences.
Keywords: Orthodontics; Alveolar bone; Periodontal attachment; CBCT.
Citation: Allemann OP, Weigang J, Bumann A. Prevalence of Bony Dehiscences in Angle-Class I, II/1, and II/2 Using CBCT. SciBase Radiol Med Imaging. 2024; 1(1): 1002.
Introduction
Bony dehiscences refer to areas where the cortical bone surrounding a tooth’s root is absent, exposing the root to the surrounding soft tissues. These dehiscences can occur on both the buccal and lingual sides of teeth and are often associated with periodontal diseases, orthodontic movements, or anatomical variations.
Bony dehiscences refer to areas where the cortical bone surrounding a tooth’s root is absent, exposing the root to the surrounding soft tissues. These dehiscences can occur on both the buccal and lingual sides of teeth and are often associated with periodontal diseases, orthodontic movements, or anatomical variations.
While several studies show that the prevalence of dehiscences is generally high [2-4], only few studies have analyzed the prevalence of dehiscences comparing different Angle-Malocclusions. Yagci et al. examined patients in Angle Class (AC) I, II, and III, and found that nearly all patients had at least one buccal dehiscence. However, they did not observe a significant difference in the incidence of dehiscences among the three groups. Most dehiscences were located in the incisor region of the mandible in all groups. In the maxilla, Class I patients had the highest prevalence of dehiscences in the incisor region (23.07%), while canines were the most commonly affected teeth in Class II (31.48%) and III (28.16%) patients [4]. Evangelista et al. found an average prevalence of dehiscences of 51.09% among the 4,319 examined teeth from patients in AC I or II/1. Patients with Class I malocclusion had a 35% higher prevalence of dehiscence compared to those with Class II Division 1 malocclusion [3].
To date, there have been no CBCT studies that have specifically investigated Class II malocclusions, which can be further categorized into Class II/1 and II/2 based on the inclination of the upper front teeth. The comparison between Class II Division 1 and Division 2 malocclusions is crucial because the distinct angulations of the upper incisors in each group may lead to different stress patterns on the alveolar bone. In Class II/1, the upper incisors are proclined, while in Class II/2, they are retroclined, which could result in varying levels of bone strain.
The study’s objective was to examine if the prevalence periodontal bone dehiscences can be anticipated solely on the Angle-Class malocclusion without further radiological analysis and whether AC II/1 and II/2 malocclusions are predominantly linked to periodontal dehiscences. A periodontal vertical bone loss over 2 mm was classified as a dehiscence [3,4].
Materials and methods
Inclusion criteria
In this study, 207 pretherapeutic CBCT images from orthodontic patients were randomly selected based on the following inclusion criteria: no previous orthodontic treatment, no deciduous teeth, no missing teeth, no teeth that did not fully reach the occlusal plane, no or mild crowding according to the little-index and a minimum image resolution of 0.25 voxel. All images were available in the collection of the institute. The division into Angle classes was assessed based on Angle’s classification. The sample classification into Class I was established based on the bilateral molar and canine relationships being in Class I, with overjet values ranging from 1 to 3 mm and 11-NSL value between 100° and 104°. Class II Division 1 subjects had bilateral molar and canine relationships in Class II, overjet >4 mm, and 11-NSL values >104°. For Class II Division 2 subjects, the criteria were bilateral molar and canine relationships in Class II, overjet <3 mm and 11-NSL <100°. This resulted in 75 Class I, 74 Class II/1, and 58 Class II/2 patients, with demographic distribution shown in (Table 1).
Technical equipment
All 207 CBCT images were captured using either the iCAT Classic or the iCAT next generation device by Imaging Sciences International, Inc. (Hatfield, USA). The selected CBCT scans had a minimum resolution of 0.2 mm to 0.25 mm. All images were analyzed under standardized conditions, including same trained examiner, a darkroom, InVivo 3D-Imaging-Software (Anatomage Inc., San Jose, California), and a standardized monitor approved for diagnostic radiology (EIZO 3 Megapixel RadiForce™ R31 Monitor).
Specific measurement of dehiscences
The teeth were grouped into seven categories: central incisors (1), lateral incisors (2), canines (3), first premolars (4), second premolars (5), first molars (6), and second molars (7). The buccal and lingual sides of each tooth (7-7) were measured individually, and the measurements were grouped by upper and lower jaw. To measure a dehiscence, the tooth was positioned vertically at a 90° angle to the horizontal plane, which was set as the lower border of the examination screen. The distance between the cemento-enamel junction and the crestal alveolar bone was measured on the lingual and buccal side, with a maximum slice thickness of 0.1 mm. The measuring points were chosen at the center of the tooth, which was half the horizontal distance between the widest part of the tooth and the apex, connecting the shortest distance between the CEJ and the alveolar crest, parallel to the tooth-axis. An example measurement can be seen in (Figure 1). A dehiscence was defined as being >2 mm, with further differentiation into those >2 mm and those >3 mm. The measurements classified as greater than 2 mm also included measurements greater than 3 mm.
Statistical analysis
Two trained examiners conducted all measurements. Inter-rater reliability was tested using the Interclass-Correlation-Test (0.973). To assess the consistency of the results, a sample of ten randomly selected data sets was remeasured on different days within one week. The mean difference between measurements was ±0.3 mm. There were no significant differences between the measurements of the two examiners (p>.38).
A power analysis was conducted to determine the sample size required to detect a medium effect size (d=0.5), with a significance level alpha of 0.05 and a desired power of 0.80. The statistical analysis was performed using IBM SPSS Statistics Premium Grad Pack 24 (Version 24, IBM, SPSS) and Microsoft Excel (Version 2016 for Windows, Microsoft, Redmond, WA, USA).
A paired t-test was employed to compare measurements within the same Angle Class, considering the equal size and non-normal distribution of the samples.
For comparisons between different Angle classes, the non-parametric Mann-Whitney U test was used, given its robustness to non-normal distributions and independence of samples.
A linear regression analysis was performed to examine the correlation between the size of the dehiscence and the age of the subjects, with assumptions of linearity.
Results
To provide an overview of the collected data, the average measurement size and standard deviation (SD) for each tooth were calculated and are presented in (Figure 2). Across all Angle Classes, buccal measurements are generally larger than lingual measurements. The statistical calculations supporting this observation are detailed later in the paper.
Notably, on the buccal side, the upper canines (teeth 13 and 23) and lower premolars (teeth 34 and 44) exhibit prominent dehiscences across all Angle Classes. On the lingual side, dehiscences are most prevalent in the upper lateral teeth and lower anterior teeth.
Comparison within angle classes
Buccal vs. lingual measurements: Regarding all measurements, measurements were highly significantly greater on the buccal side in each angle class with p<0.001 (Class I: buccal 2.08 mm ± 0.76 mm vs. lingual 1.91 mm ± 0.72 mm; Class II/1: buccal 2.32 mm ± 0.81 mm vs. lingual 2.20 mm ± 0.79 mm; Class II/2: buccal 2.27 mm ± 1.24 mm vs. lingual 2.11 mm ± 1.1 mm).
Regarding only measurements greater than 2 mm, the results did not show consistency in significance across all angle classes. For Angle Class I the average buccal measurement was 2.76 mm ± 0.64 mm, compared to 2.66 mm ± 0.51 mm on the lingual side was significantly greater (p=0.0013). In Angle Class II/1, the buccal mean was 2.79 mm ± 0.77 mm and the lingual mean was 2.79 mm ± 0.70 mm, with no significant difference (p=0.88). For Angle Class II/2, the buccal measurements averaged 3.16 mm ± 1.12 mm compared to 2.98 mm ± 0.92 mm on the lingual side (p=0.003). All results can be viewed in detail in (Table 2).
Buccal vs. lingual measurements, differentiated by upper and lower jaw: When the upper and lower jaws were analyzed separately within each class, buccal measurements were generally significantly greater than lingual measurements with two exceptions: In Angle Class I, there was no significant difference in the lower jaw, and for Angle Class II/1, in the lower jaw the lingual dehiscences were significantly greater than the buccal measurements. All results can be viewed in detail in (Table 2).
Buccal vs. lingual measurements, only frontal teeth (12-22 and 32-42): When only the upper four incisors were compared, the results showed significantly bigger measurement sizes on the buccal side across all Angle classes (p<0.001). In Angle Class I, the buccal measurement was 2.09±0.66 mm compared to 1.46±0.58 mm on the lingual side. For Angle Class II/1, the buccal measurement was 2.39±0.70 mm, while the lingual side measured 1.76±0.66 mm. In Angle Class II/2, the buccal measurement was 2.27±0.94 mm compared to 1.78±0.90 mm on the lingual side. Interestingly, when the lower four incisors were compared, the results showed lingual measurements to be generally larger than buccal measurements in Angle Classes I and II/1, with statistically significant differences, while in Angle Class II/2, the differences are not statistically significant. In Angle Class I, the average buccal measurement was 1.89±0.65 mm, while the lingual measurement was 2.06±0.67 mm, with a statistically significant difference (p=0.001). For Angle Class II/1, the buccal measurement averaged 2.12±0.79 mm compared to 2.58±0.80 mm on the lingual side, also showing a statistically significant difference (p < 0.001). In Angle Class II/2, the buccal measurement was 2.49±1.24 mm, while the lingual measurement was 2.60±1.12 mm, with the difference not being statistically significant (p=0.32). The results are visualized in (Figures 3 and 4).
Comparison between angle classes
Buccal and lingual combined: The results are presented in two categories: size and prevalence of dehiscences. Mean measurement size resulted for Angle-Class I, II/1 and II/2 of 1.99±1.18 mm, 2.26±0.74 mm and 2.18±0.80 mm respectively. Patients with Class II/1 had significantly larger dehiscences than the other two classes (2.26±0.74 mm, p<.01).
The results indicate that Class I had an average prevalence of dehiscences (measurements >2 mm) of 44.30%, Class II/1 had a prevalence of 58.21%, and Class II/2 had a prevalence of 49.10%. Class II/1 had a significantly higher prevalence of dehiscences than Class I (p<.01), but there was no significant difference between Class II/1 and Class II/2 (p>.05). When looking specifically at dehiscences greater than 3mm in size, the distribution was 9.63% for Class I, 15.49% for Class II/1, and 16.99% for Class II/2. Both subdivisions of Class II were found to be significantly greater than Class I (p<.01).
In the maxilla the number of dehiscences increases towards the canines and first premolars within each Angle-Class, to then decrease towards the second molar. In all classes the first molar showed more dehiscences than the second molar and the second premolar.
In the mandible the incisors show a similar prevalence of dehiscences as the canines and premolars in all Angle-Classes. The amount of dehiscences also decreases towards the molar region (Figure 5).
The results suggest a tendency towards higher prevalence and bigger dehiscences in patients with Class II. When comparing only the maxillary incisors (both central and lateral) among the classes, mean dehiscence sizes were 2.09±0.66 mm for Class I, 2.39±0.69 mm for Class II/1, and 2.26±0.94 mm for Class II/2. There was a significant difference between Class I and both categories of Class II (p<.01), but no significant difference between the two subcategories of Class II (p>.05).
Only buccal measurements
The buccal dehiscences (only measurements >2 mm) were compared among the angle classes. The teeth were divided in different regions which were each compared among the Angle-Classes and categorized as follows: Combined Upper and Lower Jaw, Upper Jaw, Lower Jaw, Anterior Upper (12-22), Anterior Lower (32-42), Canines Upper, Canines Lower, Lateral Upper (17-14,24-27), and Lateral Lower (37-34,44-47). Measurements below 2mm were excluded from the analysis.
The analysis revealed significant differences in measurements between Angle Class I, II/1, and II/2, with particularly significant greater dehiscences in Class II/2 compared to the other classes.
In the upper and lower jaw combined, Class II/2 consistently showed larger values compared to both Class I and Class II/1 (p<0.05). Also when looking solely at the the upper jaw and lower jaw, Class II/2 showed significantly greater dehiscences in both cases: Upper jaw (I vs. II/2, p=0.028; II/1 vs. II/2, p=0.015) and lower jaw (I vs. II/2, p=0.027; II/1 vs. II/2, p=0.036). Additionally, differences were observed in the lower canines (I vs. II/2, p=0.028; II/1 vs. II/2, p=0.014) and lateral lower teeth (I vs. II/2, p<0.001).
The most significant differences are consistently seen when comparing Class 2.2 with Class 1.0 and Class 2.1, especially in the upper and lower jaw combined and in the canine regions. This suggests that patients in Class 2.2 exhibit larger bone measurements compared to those in other Angle Classes. Table III shows the results for each compared category.
Sex
Out of a total of 207 patients, 135 were females and 72 were males. There was no significant gender specificity concerning the total number of dehiscences within all three Classes combined (female 51.39%, male 48.49%; p>.05), nor within each Angle-Class (p>.05).
Age
The statistical analysis indicates a moderate positive correlation (r=0.535) between age and the average dehiscence size, suggesting that dehiscence size tends to increase as individuals age. The regression analysis reveals that the dehiscence size increases by approximately 0.029 mm per year on average. The standard deviation of the average dehiscence size is 0.477 mm, reflecting the variability in dehiscence measurements across the sample. This finding suggests a gradual and consistent increase in dehiscence size with age (Figure 6).
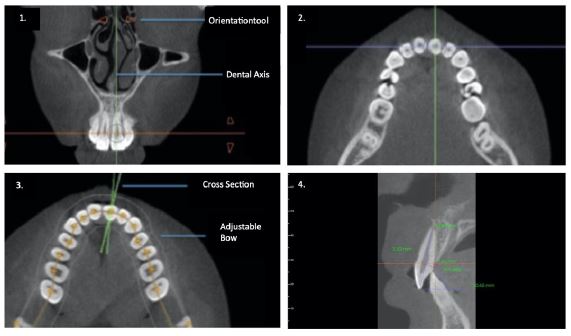
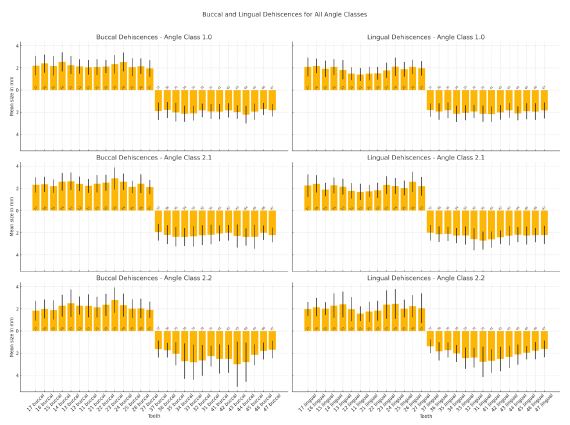
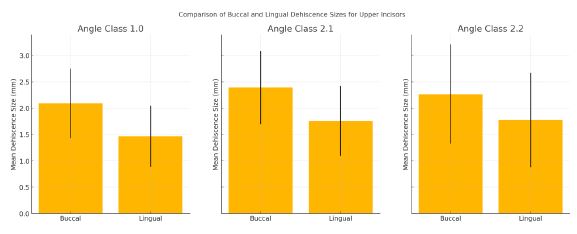
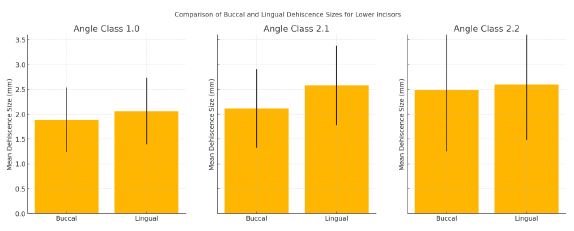
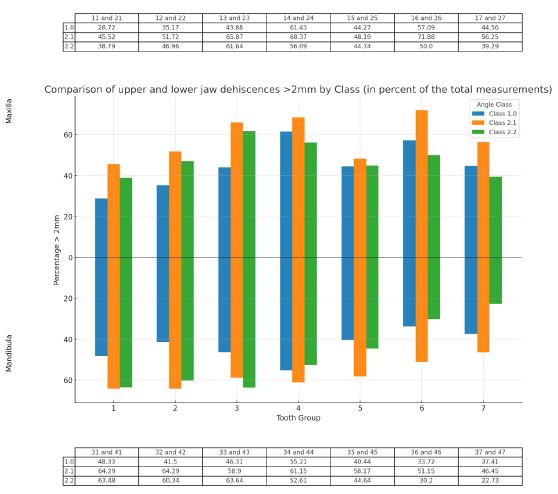
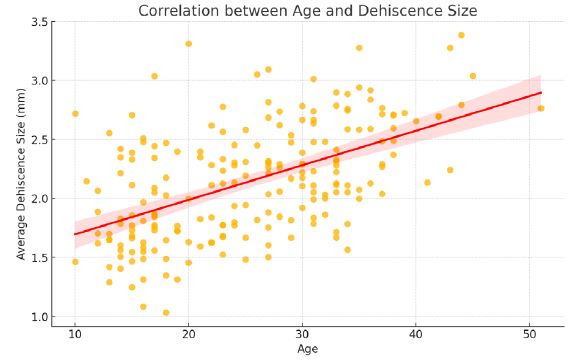
Table 1: Frontal CT scan showing the mass an upper polar tissue mass of the left kidney.
| Angle class | Total cases | Female/Male | Age | Mean age | SD |
|---|---|---|---|---|---|
| I | 75 | 44/31 | 13–41 | 27.05 | 7.29 |
| II/1 | 74 | 53/21 | 13–44 | 26.18 | 7.95 |
| II/2 | 58 | 38/20 | 10–51 | 22.07 | 10.41 |
| Total | 207 | 135/71 | 10–51 | 25.34 | 8.71 |
Table 2: Table II presents a detailed comparison of buccal and lingual measurements across different angle classes, highlighting that buccal measurements were generally greater than lingual measurements.
| Angle class | Condition | Jaw | Buccal measurement (Mean±SD) | Lingual measurement (Mean±SD) | p-value | Significance |
|---|---|---|---|---|---|---|
| 1.0 | All Measurements | Overall | 2.08 mm ± 0.76 mm | 1.91 mm ± 0.72 mm | <0.001 | Significant (greater on buccal side) |
| 1.0 | Measurements >2 mm | Overall | 2.76 mm ± 0.64 mm | 2.66 mm ± 0.51 mm | 0.0013 | Significant (greater on buccal side) |
| 1.0 | Measurements >2 mm | Upper Jaw | 2.13 mm ± 0.78 mm | 1.88 mm ± 0.72 mm | <0.001 | Significant (greater on buccal side) |
| 1.0 | Measurements >2 mm | Lower Jaw | 1.92 mm ± 0.67 mm | 1.97 mm ± 0.69 mm | 0.250 | Not Significant |
| 2.1 | All Measurements | Overall | 2.32 mm ± 0.81 mm | 2.20 mm ± 0.79 mm | <0.001 | Significant (greater on buccal side) |
| 2.1 | Measurements >2 mm | Overall | 2.79 mm ± 0.77 mm | 2.79 mm ± 0.70 mm | 0.880 | Not Significant |
| 2.1 | Measurements >2 mm | Upper Jaw | 2.36 mm ± 0.80 mm | 2.16 mm ± 0.81 mm | <0.001 | Significant (greater on buccal side) |
| 2.1 | Measurements >2 mm | Lower Jaw | 2.19 mm ± 0.82 mm | 2.30 mm ± 0.75 mm | 0.020 | Significant (greater on lingual side) |
| 2.2 | All Measurements | Overall | 2.26 mm ± 1.18 mm | 2.10 mm ± 1.01 mm | <0.001 | Significant (greater on buccal side) |
| 2.2 | Measurements >2 mm | Overall | 3.16 mm ± 1.12 mm | 2.98 mm ± 0.92 mm | 0.0025 | Significant (greater on buccal side) |
| 2.2 | Measurements >2 mm | Upper Jaw | 2.22 mm ± 1.09 mm | 2.08 mm ± 1.02 mm | 0.001 | Significant (greater on buccal side) |
| 2.2 | Measurements >2 mm | Lower Jaw | 2.37 mm ± 1.42 mm | 2.16 mm ± 0.97 mm | 0.010 | Significant (greater on buccal side) |
Table 3: Statistical comparison of average dehiscence sizes in specific tooth groups between the angle classes. Marked in orange are significant comparisons, marked in red are highly significant comparisons.
| Compared teeth | Compared angle classes | Mean values and standard deviations | p-value |
|---|---|---|---|
| Upper + Lower Jaw | |||
| 1.0 vs. 2.1 | 2.74 (0.65) vs. 2.72 (0.56) | 0.524 | |
| 1.0 vs. 2.2 | 2.74 (0.65) vs. 3.02 (0.97) | <0.001 | |
| 2.1 vs. 2.2 | 2.72 (0.56) vs. 3.02 (0.97) | 0.003 | |
| Upper Jaw | |||
| 1.0 vs. 2.1 | 2.77 (0.64) vs. 2.76 (0.70) | 0.816 | |
| 1.0 vs. 2.2 | 2.77 (0.64) vs. 3.00 (0.79) | 0.028 | |
| 2.1 vs. 2.2 | 2.76 (0.70) vs. 3.00 (0.79) | 0.015 | |
| Lower Jaw | |||
| 1.0 vs. 2.1 | 2.62 (0.52) vs. 2.67 (0.59) | 0.776 | |
| 1.0 vs. 2.2 | 2.62 (0.52) vs. 3.31 (1.44) | 0.027 | |
| 2.1 vs. 2.2 | 2.67 (0.59) vs. 3.31 (1.44) | 0.036 | |
| Anterior Upper (12–22) | |||
| 1.0 vs. 2.1 | 2.67 (0.62) vs. 2.78 (0.59) | 0.233 | |
| 1.0 vs. 2.2 | 2.67 (0.62) vs. 2.82 (0.75) | 0.212 | |
| 2.1 vs. 2.2 | 2.78 (0.59) vs. 2.82 (0.75) | 0.978 | |
| Anterior Lower (32–42) | |||
| 1.0 vs. 2.1 | 2.59 (0.58) vs. 2.54 (0.66) | 0.483 | |
| 1.0 vs. 2.2 | 2.59 (0.58) vs. 3.04 (1.24) | 0.197 | |
| 2.1 vs. 2.2 | 2.54 (0.66) vs. 3.04 (1.24) | 0.078 | |
| Canines Upper | |||
| 1.0 vs. 2.1 | 2.87 (0.83) vs. 2.90 (0.60) | 0.314 | |
| 1.0 vs. 2.2 | 2.87 (0.83) vs. 3.31 (1.16) | 0.025 | |
| 2.1 vs. 2.2 | 2.90 (0.60) vs. 3.31 (1.16) | 0.108 | |
| Canines Lower | |||
| 1.0 vs. 2.1 | 2.66 (0.44) vs. 2.65 (0.62) | 0.482 | |
| 1.0 vs. 2.2 | 2.66 (0.44) vs. 4.59 (2.46) | 0.028 | |
| 2.1 vs. 2.2 | 2.65 (0.62) vs. 4.59 (2.46) | 0.014 | |
| Lateral Upper (17–14, 24–27) | |||
| 1.0 vs. 2.1 | 2.87 (0.68) vs. 2.66 (0.51) | 0.055 | |
| 1.0 vs. 2.2 | 2.87 (0.68) vs. 2.88 (0.75) | 0.772 | |
| 2.1 vs. 2.2 | 2.66 (0.51) vs. 2.88 (0.75) | 0.113 | |
| Lateral Lower (37–34, 44–47) | |||
| 1.0 vs. 2.1 | 2.56 (0.47) vs. 2.93 (1.00) | 0.082 | |
| 1.0 vs. 2.2 | 2.56 (0.47) vs. 3.24 (1.23) | <0.001 | |
| 2.1 vs. 2.2 | 2.93 (1.00) vs. 3.24 (1.23) | 0.096 | |
Discussion
The results of this study confirm a high prevalence of dehiscences before orthodontic treatment among all analyzed Angle-Classes, with Class I showing a prevalence of 44.30%, Class II/1 showing 58.21%, and Class II/2 showing 49.10%. Other studies have also reported similarly high prevalences of dehiscences between 42.64% to 53.63% in patients with Class I and Class II malocclusions [3-6].
Due to the nature of the sample, significant dental factors related to the malocclusion were not included in this study like, symphysis width and height, vertical skeletal pattern or soft tissue phenotype.
Our study allows for differentiation between the two subdivisions, Class II/1 and Class II/2, which differ strictly by maxillary incisor inclination. We expected greater bone defects in patients with buccally-inclined teeth and analyzed patients with lingually-inclined and buccally-inclined maxillary incisors individually (Class II/1 and Class II/2). Contrary to our expectations our results show an above-average dehiscences size on the buccal side for both Angle-Classes (II/1, 2.39±0.69 mm; II/2, 2.26±0.94 mm). There were no significant differences between the two classes, although the inclination of the incisors was opposite (p>.05). Tian et al. measured bone thickness at the tooth apex for maxillary labial and lingual inclined teeth and found out, that Incisors with labial inclination exhibited thicker bone at the labial side of the root apex [7].
There is no other study, that states the correlation between tooth inclination and buccal dehiscences before orthodontic treatment, but other studies that compare the correlation before and after orthodontic treatment with a significant change in buccolingual tooth inclination also report no significant increase of the labial dehiscence size [8,9].
Our study revealed that canines, first premolars, and, interestingly, first molars are more frequently affected by dehiscences in the upper jaw (Figures 1 and 4). While this is understandable for canines and first premolars, which are located along the curvature of the jaw, no clear explanation exists for the increased susceptibility of the first molars. It is also noteworthy that this enlargement of dehiscence is not limited to the buccal side but is also observed on the lingual side. This finding is consistent with the study by Rupprecht et al., which identified the highest prevalence of dehiscences overall in the upper left first molar (11.3%) [10]. In a recent CBCT study by Mohan et al., the prevalence of dehiscence in maxillary first molars was found to be 60.95%. It was observed that molars with a buccolingual inclination greater than 9 degrees had a higher prevalence of dehiscence on the buccal side (84.6%), while those with an inclination less than 9 degrees showed more dehiscence on the lingual side (71.4%). The study did not find a significant correlation between buccolingual inclination and the extent of dehiscence or fenestration [11]. A possible explanation for the greater involvement of the first molars could be that they are the first permanent teeth to erupt and, therefore, remain in the mouth for a longer time than other permanent teeth, subjecting them to mechanical stress and wear over an extended period. Mohan et al. also pointed out that first molars are particularly susceptible to dehiscence due to their anatomical position, where the narrow morphology of the maxilla could result in resorption of the cortical bone covering the root surfaces, making the bone thinner and more prone to defects. Additionally, first molars bear significant occlusal forces over time, contributing to the higher prevalence of dehiscence [11]. In orthodontic treatment, a common technique for gaining space in the dental arch is eccentric movement and proclination of teeth. Our findings suggest, that although inclination does not seem to play the decisive role in creation of dehiscences, the thickness of labial bone does.
It was stated in multiple animal experiments with monkeys and dogs [12-15] as well as in analyses pre- and posttreatment that this approach can lead to the creation and aggravation of dehiscences and fenestrations if the periodontal bone’s thickness and height are insufficient [16-19] On the other hand, Artun and Grobety found out, that in adolescent patients with reclined teeth, where it can be assumed, that buccal cortical bone plate is sufficient, proclination does not cause changes in buccal attachement [20]. While Yu et al. reported a regain of periodontal bone density in the first year after the orthodontic retention phase [21], other studies have shown that up to 38% of orthodontic treated patients develop dehiscences and recessions within five years after treatment [22-24].
For orthodontists, it is important to diagnose beforehand, if labial bone is sufficient or if in order to prevent dehiscences, more invasive methods, such as surgically assisted rapid maxillary expansion, interproximal enamel reduction or tooth extraction should be applied [11,13,25,26].
Although Class II patients show larger dehiscences than patients with a Class I, the difference in size is mostly less than 0.5 mm on average. Therefore, the choice of diagnostic method (2D or 3D) should depend on the planned therapy rather than the dental class of the patient. Evangelista et al. came to a similar conclusion regarding facial type and dehiscences. Comparing brachy- meso- and dolychofacial growth pattern, does not seem to have an influence on the frequency of bony dehiscences and fenestrations in untreated individuals [3]. On the other hand, Sadek at al. state that patients with brachyfacial skeletal patterns, have a thinner alveolus and this may predispose them to a greater risk of developing bony dehiscence [27].
CBCT offers more detailed information than 2D radiographs and can enhance treatment planning [28,29]. It is a widely used imaging modality in dentistry and maxillofacial surgery, but balancing radiation dose and diagnostic quality is a challenge. To minimize radiation dose, CBCT scanners typically use larger voxel sizes, which reduce image quality and accuracy, particularly for detecting bony dehiscences and other conditions requiring high detail. Voxel size refers to the dimensions of a single voxel, which is the smallest distinguishable cuboid unit in a three-dimensional digital representation, such as CBCT.
Although a voxel size of 0.2 mm is widely accepted as being accurate enough for diagnostics of bony dehiscences [30-32], this study also used few CBCTs with a voxel size of 0.25 mm. This, undoubtly leads to a lesser image quality and higher difficulty in accurately diagnosing the delimitations of the alveolar crest [33]. Still, Timock et al. were able to demonstrate on human head cadavers, that even a 0,3 mm voxel-size produces images with an accuracy of 0.30±0.27 mm with no statistical significant difference compared to digital caliper measurement [34]. On the other hand, Sun et al. examined a sample of 122 anterior teeth in 14 patients with Class III malocclusion. Direct measurements of dehiscences and fenestrations were taken using a gauge during surgery, while indirect measurements were obtained through CBCT scans collected prior to treatment with a voxel size of 0.125. The study found that CBCT scans frequently result in false-positive diagnoses of dehiscences, leading to an overestimation of their actual prevalence. According to Sun et al., only dehiscences appearing as >3 mm in CBCT scans can be confidently diagnosed as clinically present [35]. CBCT can provide accurate and valuable information for orthodontic treatment planning, but voxel size and radiation exposure should be adequately adjusted to the diagnostic purpose.
Our findings suggest that the traditional classification of malocclusions based on EH Angle’s dental classes may not provide a precise assessment of the periodontal bony conditions. This is mainly due to the vague definition of Angle’s classes in the literature, which does not adequately describe the relationship between the dental and osseous structures of the jaw [36]. As a result, the Angle classification can offer only a general impression of the patient’s dental relations and malocclusion. However, despite its limitations, the Angle classification is still widely used and can aid in selecting further diagnostic measures. Further investigation is needed to explore the relationship between dehiscences and skeletal classes. Examining the prevalence of dehiscences in different combinations of skeletal and dental malocclusions, such as skeletal class I with dental class I compared to skeletal class I with dental class II, could provide valuable insights for future research.
Conclusion
The results of the study show that nearly 50% of all teeth in patients with malocclusions have bony dehiscences greater than 2 mm before orthodontic therapy. Dehiscences were found in all areas of the jaw within all malocclusions. Certain areas such as the canines of the maxilla and first premolars of the mandible are predominantly affected. In both, Class II/1 and II/2, buccal measurements in the upper incisor region were significantly greater, than on the lingual side. Sex does not seem to play a role in dehiscence prevalence.
Although patients with a Class II malocclusion appear to have a higher prevalence of buccal dehiscences, periodontal bony coverage cannot be accurately predicted using only the malocclusion-type.
Declarations: The authors declare that they have no affiliations with or involvement in any organization or entity with any financial or non-financial interest in the subject matter or materials discussed in this manuscript.
References
- Saminsky M, Meir H, Sebaoun A, Tal H. Positive relationship between the dimensions of clinical gingival recessions and associated alveolar bone dehiscences: A biometric study. Quintessence Int. 2022; 53(4): 308-13.
- Sun L, Mu C, Chen L, Zhao B, Pan J, et al. Dehiscence and fenestration of Class I individuals with normality patterns in the anterior region: A CBCT study. Clin Oral Investig. 2022; 26(5): 4137-45.
- Evangelista K, Vasconcelos Kde F, Bumann A, Hirsch E, Nitka M, et al. Dehiscence and fenestration in patients with Class I and Class II Division 1 malocclusion assessed with cone-beam computed tomography. Am J Orthod Dentofacial Orthop. 2010; 138(2): 133 e1-7.
- Yagci A, Veli I, Uysal T, Ucar FI, Ozer T, et al. Dehiscence and fenestration in skeletal Class I, II, and III malocclusions assessed with cone-beam computed tomography. Angle Orthod. 2012; 82(1): 67-74.
- Nimigean VR, Nimigean V, Bencze MA, Dimcevici-Poesina N, Cergan R, et al. Alveolar bone dehiscences and fenestrations: An anatomical study and review. Rom J Morphol Embryol. 2009; 50(3): 391-7.
- Larato DC. Alveolar plate defect in children’s skulls. J Periodontol. 1972; 43: 502.
- Tian YL, Zhao ZJ, Han K, Lv P, Cao YM, et al. The relationship between labial-lingual inclination and the thickness of the alveolar bone in the mandibular central incisors assessed with cone-beam computed tomography. Shanghai Kou Qiang Yi Xue. 2015; 24(2): 210-4.
- Alvarez MA, Mejia A, Alzate D, Rey D, Ioshida M, et al. Buccal bone defects and transversal tooth movement of mandibular lateral segments in patients after orthodontic treatment with and without piezocision: A case-control retrospective study. Am J Orthod Dentofacial Orthop. 2021; 159(3): e233-e43.
- Moura W, Henriques JFC, Gambardela-Tkacz CM, Cotrin P, Garib D, et al. Mandibular incisor inclination and gingival recession after treatment with the Jasper Jumper: A 10-year follow-up. Prog Orthod. 2021; 22(1): 45.
- Rupprecht RD, Horning GM, Nicoll BK, Cohen ME. Prevalence of dehiscences and fenestrations in modern American skulls. J Periodontol. 2001; 72(6): 722-9.
- Mohan R, Jain R, Balasubramanium A. Prevalence and extent of alveolar dehiscence and fenestration in Class I hyperdivergent subjects with different buccolingual inclinations of maxillary molar teeth: A CBCT study. Brazilian Journal of Oral Sciences. 2023; 22: e239938.
- Batenhorst KF, Bowers GM, Williams JE Jr. Tissue changes resulting from facial tipping and extrusion of incisors in monkeys. J Periodontol. 1974; 45(9): 660-8.
- Steiner GG, Pearson JK, Ainamo J. Changes of the marginal periodontium as a result of labial tooth movement in monkeys. J Periodontol. 1981; 52(6): 314-20.
- Wennstrom JL, Lindhe J, Sinclair F, Thilander B. Some periodontal tissue reactions to orthodontic tooth movement in monkeys. J Clin Periodontol. 1987; 14(3): 121-9.
- Karring T, Nyman S, Thilander B, Magnusson I. Bone regeneration in orthodontically produced alveolar bone dehiscences. J Periodontal Res. 1982; 17(3): 309-15.
- Garib DG, Yatabe MS, Ozawa TO, Filho OG. Alveolar bone morphology in patients with bilateral complete cleft lip and palate in the mixed dentition: Cone beam computed tomography evaluation. Cleft Palate Craniofac J. 2012; 49(2): 208-14.
- Picanco PR, Valarelli FP, Cancado RH, De Freitas KM, Picanco GV. Comparison of the changes of alveolar bone thickness in maxillary incisor area in extraction and non-extraction cases: Computerized tomography evaluation. Dental Press J Orthod. 2013; 18(5): 91-8.
- Allahham DO, Kotsailidi EA, Barmak AB, Rossouw PE, El-Bialy T, et al. Association between nonextraction clear aligner therapy and alveolar bone dehiscences and fenestrations in adults with mild-to-moderate crowding. Am J Orthod Dentofacial Orthop. 2023; 163(1): 22-32 e4.
- Castro LO, Castro IO, De Alencar AH, Valladares-Neto J, Estrela C. Cone beam computed tomography evaluation of distance from cementoenamel junction to alveolar crest before and after nonextraction orthodontic treatment. Angle Orthod. 2016; 86(4): 543-9.
- Artun J, Grobety D. Periodontal status of mandibular incisors after pronounced orthodontic advancement during adolescence: A follow-up evaluation. Am J Orthod Dentofacial Orthop. 2001; 119(1): 2-10.
- Yu JH, Huang HL, Liu CF, Wu J, Li YF, et al. Does orthodontic treatment affect the alveolar bone density? Medicine (Baltimore). 2016; 95(10): e3080.
- Renkema AM, Fudalej PS, Renkema A, Kiekens R, Katsaros C. Development of labial gingival recessions in orthodontically treated patients. Am J Orthod Dentofacial Orthop. 2013; 143(2): 206-12.
- Morais JF, Melsen B, De Freitas KMS, Castello Branco N, Garib DG, et al. Evaluation of maxillary buccal alveolar bone before and after orthodontic alignment without extractions: A cone beam computed tomographic study. Angle Orthod. 2018.
- Lemos Rinaldi MR, Azeredo F, Martinelli de Lima E, Deon Rizzatto SM, et al. Cone-beam computed tomography evaluation of bone plate and root length after maxillary expansion using tooth-borne and tooth-tissue-borne banded expanders. Am J Orthod Dentofacial Orthop. 2018; 154(4): 504-16.
- Wilmes B, Nienkemper M, Drescher D. Application and effectiveness of a mini-implant- and tooth-borne rapid palatal expansion device: The hybrid hyrax. World J Orthod. 2010; 11(4): 323-30.
- Jain V, Shyagali TR, Kambalyal P, Rajpara Y, et al. Comparison and evaluation of stresses generated by rapid maxillary expansion and the implant-supported rapid maxillary expansion on the craniofacial structures using finite element method of stress analysis. Prog Orthod. 2017; 18(1): 3.
- Sadek MM, Sabet NE, Hassan IT. Alveolar bone mapping in subjects with different vertical facial dimensions. Eur J Orthod. 2015; 37(2): 194-201.
- Abdelkarim A. Cone-beam computed tomography in orthodontics. Dent J (Basel). 2019; 7(3).
- Yamada C, Kita N, Kakimoto N, Murakami S, Furukawa S, et al. Spatial relationships between the mandibular central incisor and associated alveolar bone in adults with mandibular prognathism. Angle Orthod. 2007; 77(5): 766-72.
- Dong T, Yuan L, Liu L, Qian Y, Xia L, et al. Detection of alveolar bone defects with three different voxel sizes of cone-beam computed tomography: An in vitro study. Sci Rep. 2019; 9(1): 8146.
- Coda Bertea P, Dratva J, Zemp Stutz E. Female gender is associated with dental care and dental hygiene, but not with complete dentition in the Swiss adult population. J Public Health. 2007; 15: 361-7.
- Van Leeuwen BJ, Dijkstra PU, Dieters JA, Verbeek HPJ, Kuijpers-Jagtman AM, et al. Effect of voxel size in cone-beam computed tomography on surface area measurements of dehiscences and fenestrations in the lower anterior buccal region. Clin Oral Investig. 2022; 26(9): 5663-72.
- Ballrick JW, Palomo JM, Ruch E, Amberman BD, Hans MG. Image distortion and spatial resolution of a commercially available cone-beam computed tomography machine. Am J Orthod Dentofacial Orthop. 2008; 134(4): 573-82.
- Timock AM, Cook V, McDonald T, Leo MC, Crowe J, et al. Accuracy and reliability of buccal bone height and thickness measurements from cone-beam computed tomography imaging. Am J Orthod Dentofacial Orthop. 2011; 140(5): 734-44.
- Sun L, Zhang L, Shen G, Wang B, Fang B. Accuracy of cone-beam computed tomography in detecting alveolar bone dehiscences and fenestrations. Am J Orthod Dentofacial Orthop. 2015; 147(3): 313-23.
- Angle EH. Classification of malocclusion. Dental Cosmos. 1899; 41: 248-64.